
View the full results of the Times Higher Education v-c pay survey 2018 or search our interactive table below
Outrage over the high pay of UK university leaders has surfaced several times in recent years, but it has normally fizzled out quickly.
Not this past year. Since Lord Adonis, the former Labour education minister, began tweeting about the “greed” of some “grossly overpaid” vice-chancellors last summer, the topic has scarcely been out of the headlines. Within a few days, the issue of “excessive vice-chancellors’ pay” became a cause célèbre, with Jo Johnson, who was then universities and science minister, joining the chorus of disapproval from across the political divide.
Adonis’ principal target was Dame Glynis Breakwell, vice-chancellor of the University of Bath and the UK’s highest-earning university leader in 2015-16, whose pay package including pension contributions totalled £451,000. But Johnson chose to single out Sir Christopher Snowden, vice-chancellor of the University of Southampton, who earned £352,000 in 10 months in 2015-16, including pension. The minister claimed that Snowden’s salary was an example of the “endless upwards ratchet of vice-chancellors’ pay”.
Times Higher Education’s survey of vice-chancellors’ pay in the most recently reported financial year, 2016-17, reveals that Snowden’s total remuneration rose to £433,000 in 2016-17, while that of Breakwell – who announced last November that she would retire at the end of the current academic year – reached £471,000, a rise of 4.4 per cent. But even that salary looked paltry compared with the headline-grabbing £808,000 earned by Christina Slade of neighbouring Bath Spa University, a figure that – as THE revealed in December – included a £429,000 pay-off for “loss of office”.
THE’s survey – the first sector-wide analysis of UK university leaders’ pay in 2016-17 – reveals that vice-chancellors were paid an average of £268,103 in salary, bonuses and benefits. This was £10,180 more than in 2015-16, amounting to a rise of 3.9 per cent. Once employer pension contributions are included, vice-chancellors received a total pay package of £289,756 on average, a rise of 3.2 per cent. Some 13 universities paid their leaders a total of more than £400,000 in 2016-17, while 64 paid more than £300,000.
Vice-chancellor pay by university
Click on each column to sort or use search box to find an institution
*There was more than one vice-chancellor employed at this institution in 2016-17, which may skew the figures.
**Further notes exist about remuneration at this institution in 2016-17, please see the full PDF version of the table for more information.
As THE revealed in December, Michael Farthing, the former vice-chancellor of the University of Sussex, received a £230,000 pay‑off “in lieu of notice” during his final month of office, which the university said “fulfilled our contractual obligations to him”. And THE ’s survey reveals other significant pay-offs for departing vice-chancellors that have not been previously reported. For instance, Cliff Allan, head of Birmingham City University for four years until his sudden exit in October 2016, was paid £186,876 as “compensation for loss of office” on top of the £33,301 salary he was paid between August and October that year, the university’s accounts show. With the cost of two interim vice-chancellors to cover the remainder of the year, Birmingham City’s total layout on its top office amounted to £413,398, including employer pension contributions – compared with £271,464 in 2015-16. The university, which said in October 2016 that Allan’s exit was for “personal reasons”, told THE that its former leader “received compensation in line with the terms of his contract”.
Meanwhile, Calie Pistorius, who stepped down as vice-chancellor of the University of Hull in January 2017, was paid £74,000 “in connection with his retirement from office”. It meant that the South African academic, who had led the university since 2009, was paid salary and benefits of £223,000 in the six months up to his retirement, while also receiving £22,000 in employer pension contributions. With his successor, Glenn Burgess, earning a further £204,000 in pay and pensions that academic year, it took Hull’s cost of office to £449,000: almost 50 per cent higher than in 2015-16.
The university says that Pistorius had remained in post for six months after announcing his retirement in July 2016, during which he “took a three-month sabbatical to develop mutual research interests before returning to the university for a handover period. During the period of transition and sabbatical, the deputy vice-chancellor [Burgess] assumed the position of acting vice-chancellor…ensuring that any extra costs associated with this interim appointment were marginal.”
Despite the headlines they make, such pay‑offs do not actually distort average salaries very much. If those universities that had a change of leadership in 2015-16 or in 2016‑17 are excluded from calculations, average pay remains very similar: £268,291, or £289,259 if pension contributions are also counted.

Nevertheless, these exit arrangements for long-standing university leaders remain under close scrutiny. Particular eyebrows have been raised by the six-month sabbatical granted to Breakwell following her retirement after 17 years in office. For Adonis and other critics, the cost of the sabbatical – £230,000 – is a symptom of a system of university governance that has become disconnected not just from ordinary university staff, who are seething over yet another below-inflation pay rise (1.1 per cent in 2016-17) and are now striking over pensions cuts, but also from students angry about the £50,000-plus debts that many will rack up before graduation.
“Bath is an interesting case because we have never been seen as having a hugely political students’ union, but many students became quite angry about Dame Glynis’ pay because we are paying more than ever to go to university,” explains Eve Alcock, a final-year psychology student at Bath. “But if you stepped back, this was really about a failure of governance – high pay was just a symptom of it.”
Alcock, who chairs the university’s charity fundraising body RAG, began to take an interest in governance and submitted a Freedom of Information request asking for the names and positions of Bath governors since 2000. She admits that, on one level, her request yielded no bombshell revelations: all standing orders were followed and a predictable list of figures from business, law and finance had enjoyed a seat around the boardroom table over the years. But the list was still revealing. For instance, Bath’s current chair of council, Thomas Sheppard, has held senior positions at Thrings, a UK top 100 law firm with offices in Bath; when he attended his first council meeting in January 2008, the university also had a pro-chancellor, Jeremy Thring, from the same law firm, who had been a member of council as far back as 1992. Alcock also found that Thring had been appointed deputy lieutenant of Somerset in the same year, 2010, as Breakwell received the same honour (the university’s treasurer, Peter Wyman, was appointed in 2014).
Other appointments also suggest that “Bath’s senior management, and people of influence who sit on council, all seem to move in the same sorts of circles”, says Alcock, who believes that students need to ask questions about who is making decisions about their university.
“Why exactly are we getting people from big business to become so involved in institutions that are really about education,” she says, adding that the recent appointments of HSBC and Boots executives to the board of the Office for Students raises the same question.
According to Michael Carley, president of Bath’s branch of the University and College Union, this similarity in governors’ background and the long duration of Breakwell’s tenure gave rise to a “collective consciousness” among board members that led to “complacency”.
Instead of using their standing within industry to challenge senior management, lay governors tended to toe the executive’s line, says Carley. “In my time on the university council, I never saw it stop the vice-chancellor from doing what she wanted to do,” he explains. Business people in particular “come from a particular kind of organisation that thinks the chief executive is the head [and] so should influence every decision – they transfer their authority to the boss”. So any challenge came from governors from other sectors – mostly academic staff.
Such dysfunction set the scene for an acrimonious university court meeting in February 2017, in which a motion censuring the remuneration committee for allowing Breakwell’s salary to escalate was narrowly defeated by 33 votes to 30. A critical report by the Higher Education Funding Council for England, published in November, found that the vote would have passed if several members of court with “conflicts of interest” had been forced to withdraw. However, the report also revealed that no formal procedures for such withdrawals had ever been drawn up.
“Even the formal governance processes were not being respected,” Carley adds.
Bath committed to a review of its governance in advance of the Hefce report. Minutes of this year’s court meeting – which, unlike previous years, were published promptly – show a contrite Sheppard admitting that last year’s “difficult and unsatisfactory meeting…was poorly handled”, that the “voting process was flawed” and that standing orders to handle conflicts should have been in place.
The level of student interest in Bath’s governance may seem unusual, but it is perhaps indicative of a growing interest in how power more widely is wielded and how managers are chosen and held to account. In 2017, for instance, questions were asked about how a charity could spend £46 million of public money on London’s abortive Garden Bridge without a brick being laid. More recently, there has been incredulity about how the UK’s biggest construction company, Carillion, could collapse with debts of £1.5 billion a year when auditors had signed off its accounts.
Students are right to challenge the make-up of their university governing bodies, argues Michael Shattock, visiting professor at the UCL Institute of Education, who has interviewed almost 100 representatives from all levels of higher education for a forthcoming book on university governance.
Shattock, a former registrar at the University of Warwick, says that universities have created a “business model of governance packed with senior lay members from industry and finance” but with very few representatives of the rank-and-file academics who are more attuned to campus life. “My feeling is that it’s not working at the moment,” says Shattock. While he remains a “great admirer of what lay members bring to university boards”, namely their common sense and problem-solving nous, Shattock believes that the executive pay controversy has stemmed from their less admirable traits.
“There is a tendency to want to have a highly paid vice-chancellor because it shows what an important job I’m doing as a lay governor,” says Shattock, who also believes that the inexorable rise of university leaders’ salaries is, to some extent, caused by laziness. “Governors do not want to go through the hassle of appointing a new vice-chancellor, so they make sure they give [the existing one] a little more each year,” he says, citing Bath as the prime example.
Moreover, even the most astute governors can find themselves taking an overly rosy view of a university leader’s performance if their contact is limited to presentations from the senior team five or six times a year, Shattock adds: “When governors are so distant, you lose the interplay between the academic community and the lay members that we used to get.”
But other observers are wary of losing the considerable time and experience that business leaders give, usually unpaid, to university governance.
“I’m not being complacent when I say that there is no objective evidence to say that we need to rip up the governance book,” says Sir Eric Thomas, the former Universities UK president who retired as vice-chancellor of the University of Bristol in 2015, after 14 years in office. “There needs to be more transparency about how remuneration is fixed, but we shouldn’t mix up vice-chancellors’ pay with how universities are governed,” he adds.
Thomas, who is now a governor at University of the Arts London and a trustee at NMITE, the new engineering university planned for Hereford, says that the advice of lay governors was invaluable when he was at Bristol. “The art of the game is to get the best people and a good spread of skills – that might mean someone from a legal background, someone with HR skills, someone from the health service and someone from finance and, perhaps, PR. You certainly need one or two people with knowledge of running a business as they understand the level of designation used by a vice-chancellor,” Thomas says, in reference to the challenge of managing Bristol’s 6,000-strong workforce.
And he rejects the idea that university leaders like to “manage” their governing bodies by feeding them only information that is largely positive. “That is absolutely the wrong path to take,” says Thomas, who maintains that it is “absolutely essential for governors to know that you are telling them everything they need to know”. In Bristol’s case, his chairs in particular were very much in touch with everyday academic life, typically spending a day and a half a week “sitting down with me or talking to other people like the registrar or company secretary”.
Higher education would not have become one of the UK’s biggest strengths if it had been founded on poor governance, Thomas concludes.
However, others with skin in the game see room for much improvement. One example is Neil Goulden, chair of Nottingham Trent University’s board of governors, who believes that “things have gone a bit awry recently because people got a bit lazy about ensuring good governance – and that became an issue thanks to vice-chancellors’ pay”.
New draft guidance on setting senior pay, published by the Committee for University Chairs in December, is “far too wishy-washy”, says Goulden, who is the former chief executive of betting firm Gala Coral Group and is now chairman of Clarion Housing Association, which manages 135,000 homes. “It is very self-justifying and needs to be much more prescriptive around excessive pay and transparency,” he says of the voluntary code. “It should not just suggest that a student or staff member should be on the remuneration committee – it should be embedded in the code,” he argues.
Goulden is no fan of the Office for Students’ proposal to require institutions to justify the salaries of all staff earning more than the £150,000 paid to the prime minister, calling that threshold “arbitrary” and inviting “pejorative and uninformed” comments on pay levels. However, he believes that more transparency is needed. “If you look at publicly quoted companies, they are disclosing 14-page reports into the details of their remuneration committees,” he says, comparing this with more sparse details currently published by universities.
But John Rushforth, executive secretary of the CUC, believes that the new code, which is now being consulted on, will substantially improve transparency. It will address concerns about vice-chancellors sitting on remuneration committees and exerting influence even if they have never been allowed to vote on decisions related to their own pay, he says. According to a recent UCU survey, only seven out of 91 universities surveyed confirmed that their vice-chancellor was neither on the committee that set senior pay nor permitted to attend meetings anyway (a practice that will be discouraged under the draft code).
But any requirement for students, for instance, to be on remuneration committees would not sit well with the CUC’s voluntary code, Rushforth insists. “You have to remember CUC is not a regulator – we have no powers of enforcement, so unless there is a very clear consensus on an issue, it is quite difficult to deliver,” he observes. Having spoken to representatives of students’ unions, he is also not sure that students want to sit on such boards, making largely technical assessments about pay: “I can see the argument for it helping transparency, but we are addressing this head‑on with the new code.”
The code’s proposal to require universities to provide particularly strong public justification for paying their vice-chancellors more than 8.5 times the median salary of their workforce has also been seen as too soft. With the median employee in higher education earning £37,643 in 2016, vice-chancellors would need to earn more than £323,000 to be affected by the rule. As noted by Michael Nisbet, a retired management consultant, in a submission to the House of Commons Education Committee’s current inquiry on value for money in higher education, only a dozen surpassed that threshold in 2015‑16. THE’s survey reveals that, in 2016‑17, the total cost of office passed that threshold at 31 UK universities, although four of those had changed their vice-chancellor in that year.
Rushforth disagrees, stating that the average pay multiple of 6.5 would be an instructive reference point for pay discussions. “It would affect every vice-chancellor because their university will have to decide whether they should be above or below this,” he says.
John Raftery, vice-chancellor of London Metropolitan University, welcomes the CUC’s new code and believes that the criticism of some vice-chancellors’ pay has gone too far, condemning the “selective singling-out of certain vice-chancellors for opprobrium”.
Raftery, whose pay package, including pension contributions, totalled £328,000 in 2016-17, up by 29 per cent on 2015-16, says that it is not unreasonable for those involved in a high-performing sector to receive fair remuneration. “If you were to recognise what the UK does successfully, you would probably mention design, music and higher education,” he explains. “Why has the government thrown so much negativity towards a high-performing sector? Why is there no mention that the head of the Harris Federation [a school academy chain] is paid £500,000?”
Governors should set the pay of vice-chancellors based on performance, he says, pointing to the improvements in student outcomes and financial stability that he has presided over at London Met since 2014. “Salaries should not be decided by the prestige of an institution, perhaps not even its size…but on the demands of the job and the change they bring about,” he says.
Mark Anderson, chair of London Met’s board, said that Raftery accepted a salary “below the median for the sector” when he joined in 2014, but the board agreed that “his pay should be linked to performance”. In light of the university’s “dramatic turnaround” under Raftery’s leadership – including overtaking 45 other universities on graduate employment outcomes – the remuneration committee “recommended [in late 2016] that his salary should be bought up to the median level for the sector in recognition of the impact he has had”.
But, whatever the rights and wrongs of individual pay awards, it seems that there is plenty more mileage in attacking vice-chancellors’ pay. Earlier this month, Adonis opened a new broadside on a visit to the University of Cambridge, calling its new vice-chancellor, Stephen Toope, “grossly overpaid” for his £365,000 pay packet, and lamenting the university’s involvement in a “culture of shameless greed”. Whether tweaks to governance, or even wholesale reform, can help alter this perception remains doubtful.
Overpaid? That’s not how it looks from here
How vice-chancellors’ pay compares with that of other leaders in UK public, quasi-public and commercial organisations
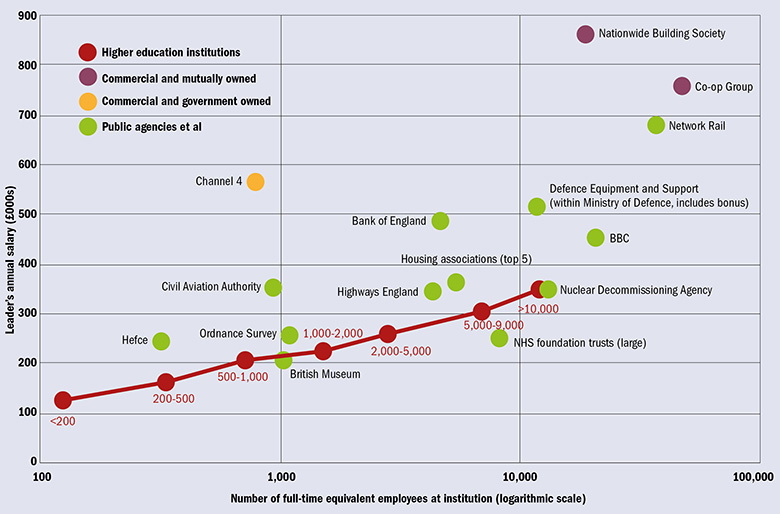
Data points for vice-chancellors’ salaries are marked in red and refer to median point in specified size category, where the figure refers to the number of employees
Data compiled by Michael Nisbet. Vice-chancellors’ data are for 2015-16. Other salaries are taken from annual reports, mostly for 2016-17.
Should a vice-chancellor be paid more than the £150,000 earned by the prime minister? While this question is moot – all but Writtle University College, a specialist agricultural institution, paid their leader a larger sum in 2016-17 – it nonetheless continues to inform debate about senior pay in universities.
But there are many more public-sector employees earning much more than £150,000, says Michael Nisbet, an economist and retired management consultant who has researched senior pay across all sectors. Based on figures collected by the Office for National Statistics’ Annual Survey of Hours and Earnings, about one in 100 public-sector employees (some 43,000 in total) earns more than £113,000, while salaries in excess of £200,000 are not uncommon for chief executives regarded, like vice-chancellors, as being within the public or the not-for-profit sector, Nisbet says.
For instance, Jim O’Sullivan, chief executive of Highways England, received £336,868 in 2016‑17 for leading an organisation with about 4,400 staff – a workforce equivalent to a mid-sized university. In comparison, the median pay of vice-chancellors leading universities with 2,000 to 5,000 staff was £255,000 in 2015-16, Nisbet calculates.
That discrepancy is not a one-off: the UK’s five largest housing associations pay their chief executives a median salary of £358,000 a year for leading workforces that all number about 5,500 staff.
Someone leading a UK university with between 5,000 and 9,000 full-time staff – Russell Group universities employ about 7,000 staff on average – receives a median of £298,000 in pay, Nisbet calculates. Far smaller public-sector organisations pay their leaders larger amounts, he adds: for instance, the Civil Aviation Authority, with fewer than 1,000 staff, paid its chief executive, Andrew Haines, some £356,400 in 2016‑17, its latest accounts show.
A more realistic view of executive pay within both the public and private sectors is needed, Nisbet says. He calculates that about 20,000 people in the UK earned more than £320,000 last year – but only 14 vice-chancellors had salaries above this level in 2015‑16.
Overall, the median pay for university heads in 2016-17 was £261,289, or £287,000 when pension contributions are included.
So why the objections over university leaders’ pay? Nisbet believes that it is caused in part by a failure to recognise general salary inflation: “Someone forming their views on actual salaries in 1997 might note a top salary of £180,000,” he explains. “They may not have absorbed that that is the same [money] salary as £315,000 in 2017.”
Very few people understand the internal pay structures of organisations, where someone at a higher level of responsibility and accountability will typically earn 60 per cent more than the person immediately below them, Nisbet adds. With three or four levels of management above professors, who on average earn about £76,000, the pay and rewards soon shoot up, he observes.
“Another reason may be simple envy, which can be very destructive of individuals and societies,” he concludes.
Jack Grove
|
University |
Vice-chancellor/chief executive |
Basic salary 2016-17 (£) |
Total including pension 2016‑17 (£) |
|
Sir Ian Diamond |
277,000 |
327,000 |
|
|
Nigel Seaton |
183,000 |
216,000 |
|
|
John Grattan |
103,000 |
157,000 |
|
|
Elizabeth Treasure (from 1 April 17) |
73,000 |
75,000 |
|
|
Aberystwyth total |
176,000 |
232,000 |
|
|
Anglia Ruskin University |
Iain Martin |
265,000 |
307,000 |
|
Stuart Bartholomew |
184,647 |
219,843 |
|
|
Dame Julia King |
70,000 |
110,863 |
|
|
Alec Cameron (from 1 Nov 16) |
245,000 |
286,937 |
|
|
Aston total |
315,000 |
397,800 |
|
|
John Hughes |
248,000 |
253,000 |
|
|
Dame Glynis Breakwell |
401,000 |
471,000 |
|
|
Christina Slade1~ |
679,000 |
808,000 |
|
|
Bill Rammell |
234,000 |
269,000 |
|
|
David Latchman |
350,064 |
386,098 |
|
|
Sir David Eastwood2 |
436,000 |
439,000 |
|
|
Cliff Allan3 |
220,177 |
225,836 |
|
|
Graham Henderson ** (17 Oct-29 Nov 16) |
41,372 |
41,474 |
|
|
Graham Upton **~ (from 30 Nov 16) |
145,785 |
146,088 |
|
|
Birmingham City total |
407,334 |
413,398 |
|
|
Bishop Grosseteste University |
Peter Neil |
158,222 |
191,668 |
|
John Vinney |
249,000 |
304,000 |
|
|
Brian Cantor |
250,000 |
250,000 |
|
|
Debra Humphris |
237,585 |
237,585 |
|
|
Hugh Brady |
271,000 |
333,000 |
|
|
Brunel University London |
Julia Buckingham |
310,000 |
329,000 |
|
Sir Anthony Seldon*** |
191,268 |
191,268 |
|
|
Bucks New University |
Rebecca Bunting |
202,000 |
235,000 |
|
Sir Leszek Borysiewicz~ |
343,000 |
362,000 |
|
|
Rama Thirunamachandran |
260,000 |
260,000 |
|
|
Colin Riordan4 |
247,000 |
302,000 |
|
|
Antony Chapman |
17,313 |
20,920 |
|
|
Cara Aitchison (from 1 Oct 16) |
183,333 |
227,820 |
|
|
Cardiff Metropolitan total |
200,646 |
248,740 |
|
|
University of Central Lancashire |
Mike Thomas |
250,000 |
258,000 |
|
Tim Wheeler |
271,000 |
273,000 |
|
|
Clive Behagg |
129,512 |
150,856 |
|
|
Jane Longmore (from 2 May 17) |
40,652 |
47,351 |
|
|
Chichester total |
170,164 |
198,207 |
|
|
Sir Paul Curran |
309,000 |
390,000 |
|
|
Deborah Swallow |
191,000 |
191,000 |
|
|
John Latham |
269,394 |
314,966 |
|
|
Sir Peter Gregson |
286,000 |
364,000 |
|
|
Julie Mennell |
181,980 |
211,935 |
|
|
Dominic Shellard |
286,000 |
331,000 |
|
|
Kathryn Mitchell |
232,200 |
269,822 |
|
|
Sir Pete Downes |
266,000 |
266,000 |
|
|
Stuart Corbridge |
286,000 |
302,000 |
|
|
David Richardson |
240,000 |
291,000 |
|
|
John Joughin |
250,000 |
294,000 |
|
|
John Cater |
333,000 |
343,000 |
|
|
Sir Timothy O’Shea5~ |
277,000 |
321,000 |
|
|
Andrea Nolan |
196,000 |
226,000 |
|
|
Anthony Forster |
257,274 |
316,240 |
|
|
Sir Steve Smith |
315,000 |
424,000 |
|
|
Anne Carlisle |
231,000 |
309,000 |
|
|
Sir Anton Muscatelli |
279,000 |
329,000 |
|
|
Pamela Gillies |
226,000 |
263,000 |
|
|
Tom Inns |
151,000 |
177,000 |
|
|
Stephen Marston |
167,000 |
193,000 |
|
|
Patrick Loughrey |
245,000 |
287,000 |
|
|
David Maguire |
236,655 |
275,031 |
|
|
Lynne Williams |
145,000 |
169,000 |
|
|
David Llewelyn |
180,000 |
210,000 |
|
|
Richard Williams |
265,000 |
285,000 |
|
|
Quintin McKellar |
282,000 |
339,000 |
|
|
Clive Mulholland |
211,000 |
232,000 |
|
|
Bob Cryan |
314,613 |
371,243 |
|
|
Calie Pistorius6 (up to Jan 17) |
214,000 |
245,000 |
|
|
Glenn Burgess7**~ |
173,000 |
204,000 |
|
|
Hull total |
387,000 |
449,000 |
|
|
Alice Gast |
355,000 |
433,000 |
|
|
Paul Workman |
269,000 |
269,000 |
|
|
Trevor McMillan |
253,000 |
267,000 |
|
|
Dame Julia Goodfellow~ |
299,000 |
324,000 |
|
|
Edward Byrne |
350,000 |
425,000 |
|
|
Julius Weinberg |
40,000 |
41,000 |
|
|
Steven Spier (from 3 Oct 16) |
169,000 |
190,000 |
|
|
Kingston total |
209,000 |
231,000 |
|
|
Mark E. Smith |
268,000 |
317,000 |
|
|
Sir Alan Langlands |
281,000 |
294,000 |
|
|
Simone Wonnacott |
165,000 |
186,000 |
|
|
Peter Slee |
222,000 |
259,000 |
|
|
Margaret House |
170,115 |
193,328 |
|
|
Paul Boyle |
278,000 |
288,000 |
|
|
Mary Stuart |
251,000 |
291,000 |
|
|
Dame Janet Beer |
266,900 |
363,300 |
|
|
Gerald Pillay |
264,723 |
313,875 |
|
|
Mark Featherstone-Witty |
171,578 |
171,578 |
|
|
Nigel Weatherill |
285,446 |
287,797 |
|
|
Janet Hemingway |
303,000 |
309,000 |
|
|
University of London |
Sir Adrian Smith |
175,307 |
175,307 |
|
Sir Andrew Likierman~ |
445,000 |
458,000 |
|
|
John Raftery |
259,000 |
328,000 |
|
|
Craig Calhoun |
26,000 |
31,000 |
|
|
Julia Black**~ (from 1 Sep 16) |
259,000 |
278,000 |
|
|
LSE total |
285,000 |
309,000 |
|
|
Peter Piot |
327,000 |
379,000 |
|
|
David Phoenix |
258,000 |
288,000 |
|
|
Robert Allison |
240,000 |
283,200 |
|
|
Dame Nancy Rothwell |
260,000 |
306,000 |
|
|
Malcolm Press |
288,000 |
333,000 |
|
|
Tim Blackman |
260,000 |
318,000 |
|
|
Chris Brink |
104,100 |
138,000 |
|
|
Chris Day (from 2 Jan 17) |
171,700 |
218,100 |
|
|
Newcastle total |
275,800 |
356,100 |
|
|
Peter Lutzeier |
68,004 |
79,211 |
|
|
Scott Davidson (from 1 Jan 17) |
94,500 |
110,074 |
|
|
Newman total |
162,504 |
189,285 |
|
|
Nick Petford |
192,000 |
254,000 |
|
|
Andrew Wathey |
264,000 |
309,000 |
|
|
John Last |
177,310 |
178,955 |
|
|
Sir David Greenaway~ |
295,000 |
381,000 |
|
|
Edward Peck |
250,000 |
319,000 |
|
|
Peter Horrocks |
345,000 |
360,000 |
|
|
Louise Richardson |
354,000 |
430,000 |
|
|
Alistair Fitt |
233,300 |
238,199 |
|
|
Cara Aitchison |
37,000 |
38,000 |
|
|
Karen Cook** (from 1 Oct 16) |
67,000 |
79,000 |
|
|
Rob Warner (from 1 Mar 17) |
70,000 |
80,000 |
|
|
Plymouth Marjon total |
174,000 |
197,000 |
|
|
Plymouth University |
Judith Petts |
240,648 |
273,294 |
|
Graham Galbraith |
266,000 |
305,000 |
|
|
Petra Wend |
210,000 |
247,000 |
|
|
Simon Gaskell~ |
275,000 |
290,783 |
|
|
Patrick Johnston^ |
236,000 |
295,000 |
|
|
James McElnay (from 16 June 17) |
25,000 |
32,000 |
|
|
Queen’s total |
261,000 |
327,000 |
|
|
Linda Drew |
140,425 |
163,567 |
|
|
Sir David Bell |
260,383 |
307,252 |
|
|
Aldwyn Cooper |
254,000 |
279,000 |
|
|
Ferdinand von Prondzynski |
235,742 |
278,436 |
|
|
Paul O’Prey |
262,000 |
312,000 |
|
|
Michael Earley |
149,890 |
177,781 |
|
|
Jonathan Freeman-Attwood |
210,721 |
214,746 |
|
|
Chris Gaskell |
14,167 |
14,167 |
|
|
Joanna Price (from 1 Sept 16) |
140,426 |
173,799 |
|
|
Royal Agricultural total |
154,593 |
187,966 |
|
|
Gavin Henderson |
176,727 |
208,140 |
|
|
Paul Thompson |
225,000 |
275,427 |
|
|
Colin Lawson |
237,518 |
243,218 |
|
|
Jeffrey Sharkey |
138,000 |
165,000 |
|
|
Paul Layzell |
301,000 |
313,000 |
|
|
Royal Northern College of Music |
Linda Merrick |
137,000 |
161,000 |
|
Stuart Reid |
307,420 |
354,057 |
|
|
Garry Taylor** |
11,000 |
11,000 |
|
|
Sally Mapstone (from 1 Sept 16) |
220,000 |
250,000 |
|
|
St Andrews total |
231,000 |
261,000 |
|
|
Jenny Higham8 |
276,000 |
276,000 |
|
|
Francis Campbell |
169,000 |
195,000 |
|
|
Helen Marshall |
204,000 |
217,000 |
|
|
Sir Keith Burnett |
389,289 |
426,589 |
|
|
Chris Husbands9 |
240,000 |
298,000 |
|
|
Soas, University of London |
Baroness Amos |
229,967 |
271,361 |
|
Julie Lydon |
225,000 |
228,000 |
|
|
Sir Christopher Snowden |
423,000 |
433,000 |
|
|
Southampton Solent University |
Graham Baldwin |
213,514 |
259,261 |
|
Janet Swadling** |
48,000 |
57,000 |
|
|
Wayne Powell (from 1 July 16) |
152,000 |
177,000 |
|
|
SRUC total |
200,000 |
234,000 |
|
|
Staffordshire University |
Liz Barnes |
198,000 |
233,000 |
|
Gerard McCormac |
269,000 |
276,000 |
|
|
Jim McDonald |
299,000 |
366,000 |
|
|
Richard Lister |
144,000 |
187,000 |
|
|
Shirley Atkinson |
202,000 |
239,000 |
|
|
Max Lu |
310,000 |
366,000 |
|
|
Michael Farthing10 |
249,000 |
252,000 |
|
|
Adam Tickell (from 1 Sep 16) |
267,000 |
293,000 |
|
|
Sussex total |
516,000 |
545,000 |
|
|
Richard Davies |
247,000 |
254,000 |
|
|
Paul Croney |
212,310 |
292,028 |
|
|
Anthony Bowne |
177,530 |
206,787 |
|
|
Michael Arthur |
365,208 |
372,825 |
|
|
Paddy Nixon |
260,000 |
311,000 |
|
|
Nigel Carrington |
265,364 |
265,485 |
|
|
Ray Linforth |
245,000 |
245,000 |
|
|
Simon Ofield-Kerr |
79,440 |
92,250 |
|
|
Alan Cooke** (from 1 Jan 17) |
52,515 |
62,390 |
|
|
Bashir Makhoul (from 5 June 17) |
16,827 |
19,600 |
|
|
UCA total |
148,782 |
174,240 |
|
|
Medwin Hughes11 |
223,000 |
279,000 |
|
|
Stuart Croft |
283,000 |
332,000 |
|
|
Peter John |
271,000 |
297,000 |
|
|
Craig Mahoney |
223,000 |
262,000 |
|
|
University of the West of England |
Steve West |
254,120 |
326,012 |
|
Geoffrey Petts |
296,000 |
301,000 |
|
|
Joy Carter |
215,520 |
261,289 |
|
|
Geoff Layer |
271,000 |
283,000 |
|
|
David Green |
325,000 |
325,000 |
|
|
Wrexham Glyndwr University |
Maria Hinfelaar |
187,035 |
217,858 |
|
Stephen Waite |
134,000 |
136,000 |
|
|
Koen Lamberts |
248,333 |
293,978 |
|
|
Karen Stanton |
200,000 |
200,000 |
|
|
|
|||
|
Total |
|
39,484,561 |
44,912,179 |
|
Average |
|
254,739 |
289,756 |
|
Median |
|
253,000 |
287,000 |
Notes: Figures typically represent the period 1 August 2016 to 31 July 2017. Figures for 2015-16, on the basis of which percentage changes are calculated, are taken from the most recent accounts except where indicated. In some cases, these differ slightly from the figures Times Higher Education published last year.
The University of Bolton is not included in this table as its accounts were not ready by the time THE went to press
‡ payment made “in respect of an unregistered, unfunded retirements benefits scheme”
~ = no longer in post
^ = died in office
* = accounts are for 1 April 2016 to 31 March 2017
** = acting vice-chancellor
*** = accounts are for calendar year 2016; 2015 figures relate to a lower-paid acting vice-chancellor; in 2016, the vice-chancellor announced he would donate £41,000 of his £191,000 salary to charity in 2017
1 Salary includes £429,000 in “compensation for loss of office”
2 A long-term incentive plan is in place for the vice-chancellor for an initial period of four years commencing 2015-16, with a total maximum value of £80,000
3 Salary includes £186,876 in compensation for loss of office
4 Salary excludes a five-year deferred bonus arrangement in place, with a maximum of £49,000 payable in December 2017
5 Salary includes £20,000 “lump sum”
6 Salary includes £74,000 payment “in connection with retirement from office”
7 Burgess was both acting and deputy v-c during 2016-17, and the figures are the total for the financial year
8 Salary includes a £47,000 clinical excellence award
9 Figures for 2015-16 are taken from 2016 accounts as the 2017 accounts only include details of Chris Husbands’ salary in that year, as opposed to the total cost of office
10 Salary includes £230,000 paid in lieu of notice
11 University of Wales Trinity St David shares its vice-chancellor with the University of Wales, which pays 20 per cent of the amounts indicated
Source: Figures taken from universities’ financial statements
POSTSCRIPT:
Print headline: Chalk it up to oversight
Register to continue
Why register?
- Registration is free and only takes a moment
- Once registered, you can read 3 articles a month
- Sign up for our newsletter
Subscribe
Or subscribe for unlimited access to:
- Unlimited access to news, views, insights & reviews
- Digital editions
- Digital access to THE’s university and college rankings analysis
Already registered or a current subscriber?


