View data: UK university salaries for academics and professional and support staff 2015-16
The subject of pay in higher education, as in any other line of work, is a thorny issue. Fierce debate is sparked by questions such as how pay should best be measured and what the fairest way is to compare the levels associated with different groups, ranks and institutions.
Over the past few years, Times Higher Education has tried to inform that debate by publishing a snapshot of average pay for all full-time university staff across the UK. The figures, provided by the Higher Education Statistics Agency, are broken down by role and by gender, giving a fascinating insight into a range of contentious issues around pay. This year, for the first time, THE has also obtained statistics on average pay by ethnicity. And, while needing to be treated with caution, these hint at the large pay disparities that many have suspected exist.
Examining the overall level of pay does not at first unveil too many surprises: the mean average full-time salary for the sector was £40,449 in 2015-16, up from £40,101 in 2014-15: a rise of just under 1 per cent (unsurprisingly this is the same as the headline pay rise given to staff that year).
As with all pay data, caveats have to be borne in mind. For instance, the mix of roles in a large category such as “all academics” can affect the data, and large salaries in a category with smaller numbers can skew the average. This is particularly so at an institutional level – analysis of which suggests that among larger, non-specialist institutions, the London School of Economics is the top payer for both professors (£103,886) and academics as a whole (£65,177), while Soas, University of London, pays its non-academic staff the most (£40,502).
Looking for vice-chancellor pay information? See our 2017 v-c pay survey
However, breaking down the pay data at a sector-wide level starts to reveal slightly differing patterns among different job types. Average pay for professors in the UK, for instance, rose by 1.1 per cent to £79,030 in 2015-16. But when considering everyone on an academic contract, average pay went up only 0.7 per cent, to £49,408.
Meanwhile, professional and support staff saw their average salaries rise by 1.25 per cent to £31,934, possibly reflecting higher pay rises awarded to staff on lower rungs of the national pay spine. Meanwhile, the most senior administrators – classified by Hesa as “managers, directors and senior officials” – saw a pay rise of 2 per cent, reaching an average of £56,677.
Real-term differences in pay compared with benchmark year
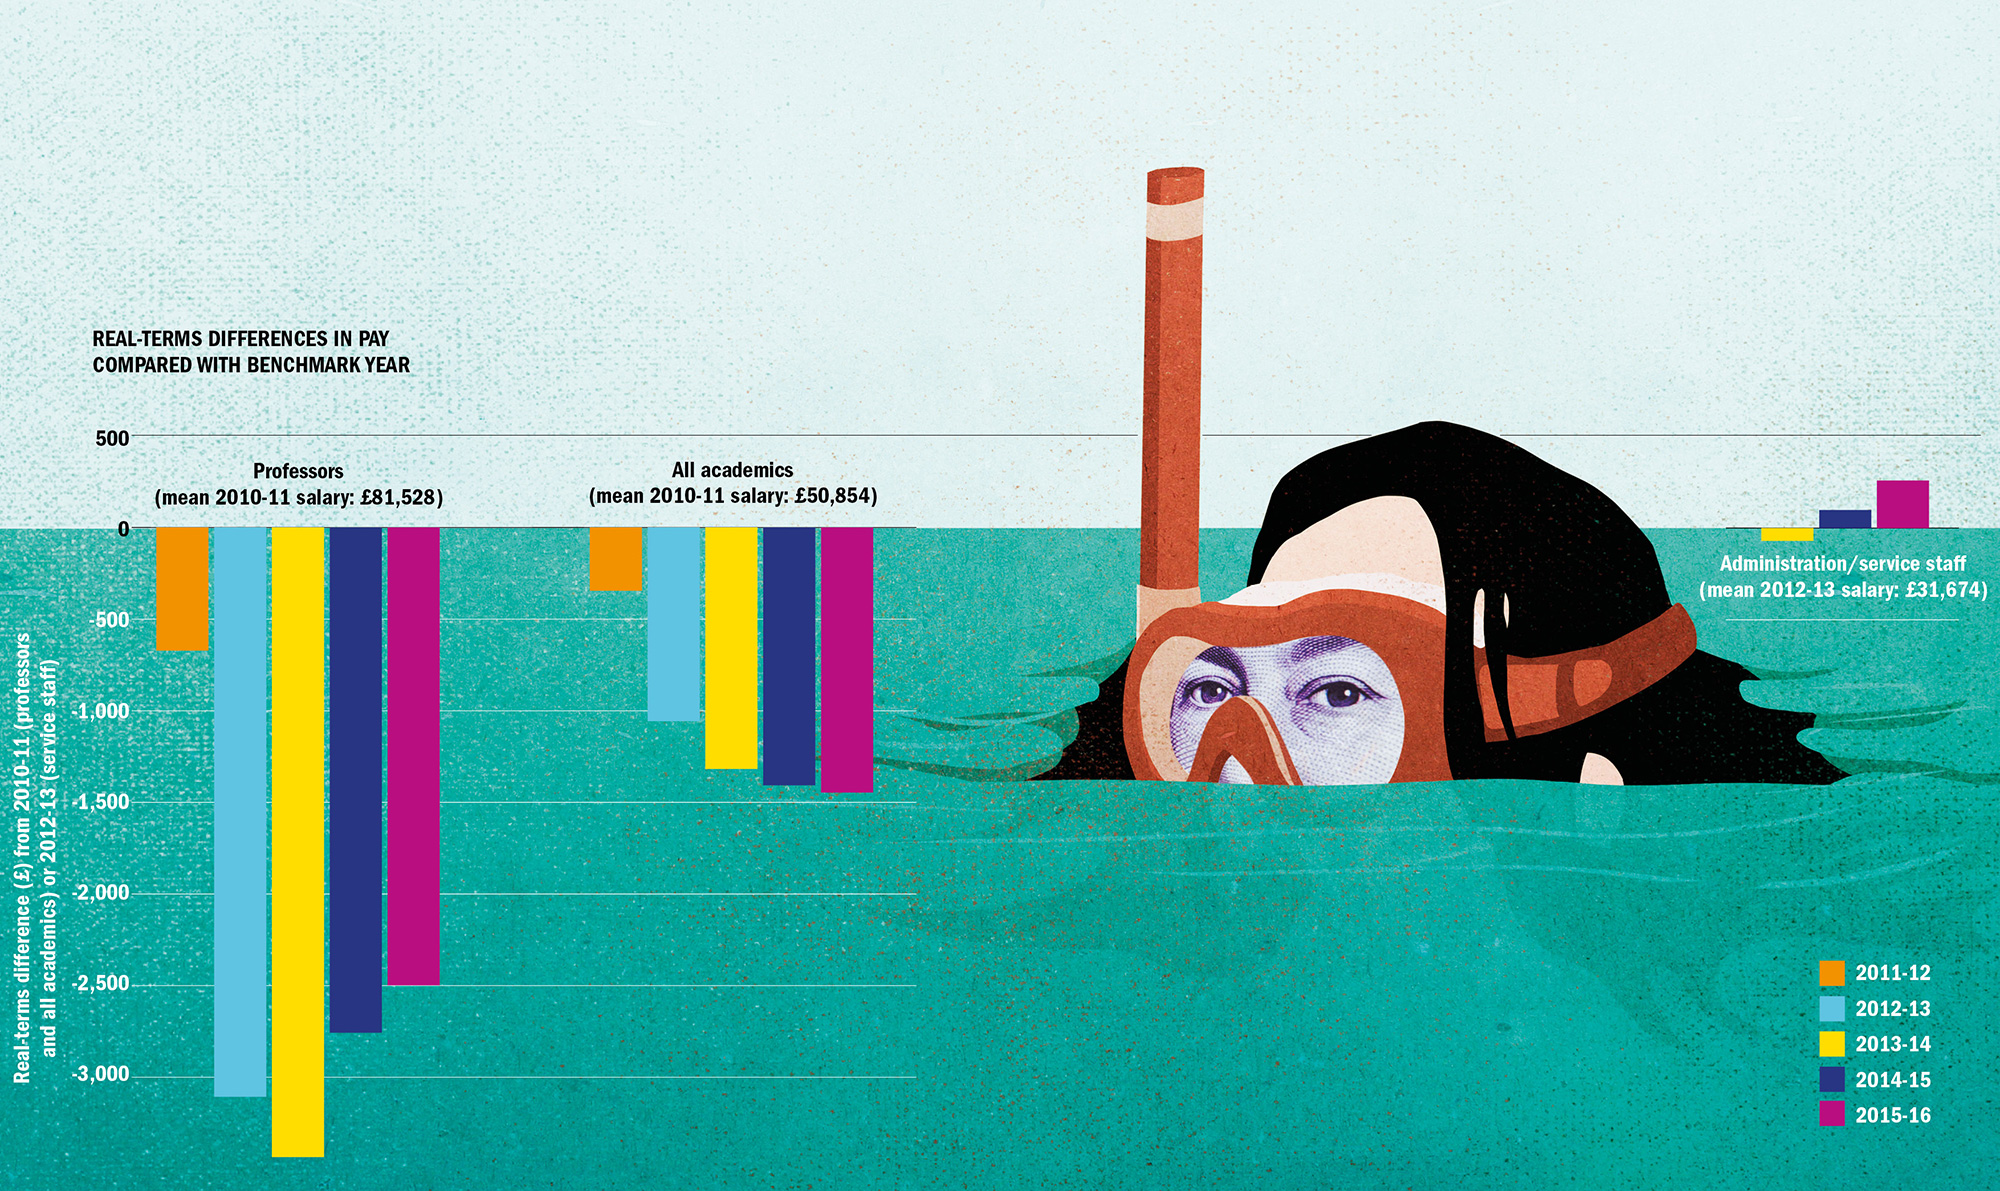
The differences between these figures are relatively small, so perhaps not too much can be read into a single year’s change. However, once data from previous years are added into the picture – and especially once the increasing cost of living in the UK is taken into account – the true cost to university staff of the squeeze on finances in the past few years becomes clear. The average pay for all academic staff dropped in real terms by 2.8 per cent from 2010-11 to 2015-16 and by 3.1 per cent for professors. And while average professorial pay has actually kept slightly ahead of inflation over the past two years, the pay of academic staff as a whole saw a real-terms fall in every year from 2010-11 to 2015-16.
The comparative data that THE has for administrative staff only go back to 2012-13, but that group as a whole has fared slightly better in comparison: average pay rose in real terms by 0.8 per cent from 2012-13 to 2015-16 and the past two years have seen real-terms increases of 0.5 per cent each year.
According to Helen Fairfoul, chief executive of the Universities and Colleges Employers Association, the real-terms cuts for university staff compared with 2010-11 need to be placed in the context of the general pay stagnation across the economy that has been imposed since the recession that followed the banking crisis.
“Our analysis shows that pay in higher education has remained in step with the wider economy and that pay for the range of jobs in the sector remains competitive. Coupled with excellent pension schemes and other benefits, [higher education institutions] continue to offer an excellent total reward package for academic and professional services staff,” she says.
But the University and College Union, which has often highlighted the erosion of real-terms pay in higher education during its seemingly endless battle with Ucea over annual pay rises, draws attention to a fall in 2015-16 in the proportion of total university expenditure going towards staff. Inevitably, it also flags up the large pay increases enjoyed by university leaders in recent years. Although the Hesa data do not list these figures, THE’s own annual survey of vice-chancellors’ pay suggests that the average cost of their salary and benefits to each university rose by 12 per cent in real terms from 2010-11 to 2014-15.
“While staff pay has been repeatedly held down by universities insisting that real-term pay cuts are at the limit of affordability, the amount spent on staff as a proportion of universities’ spending has dropped. Embarrassingly, vice-chancellors have been spared this penny pinching and continue to spend lavishly on capital projects,” claims Sally Hunt, UCU general secretary.
Money talk: average pay for full time staff by type
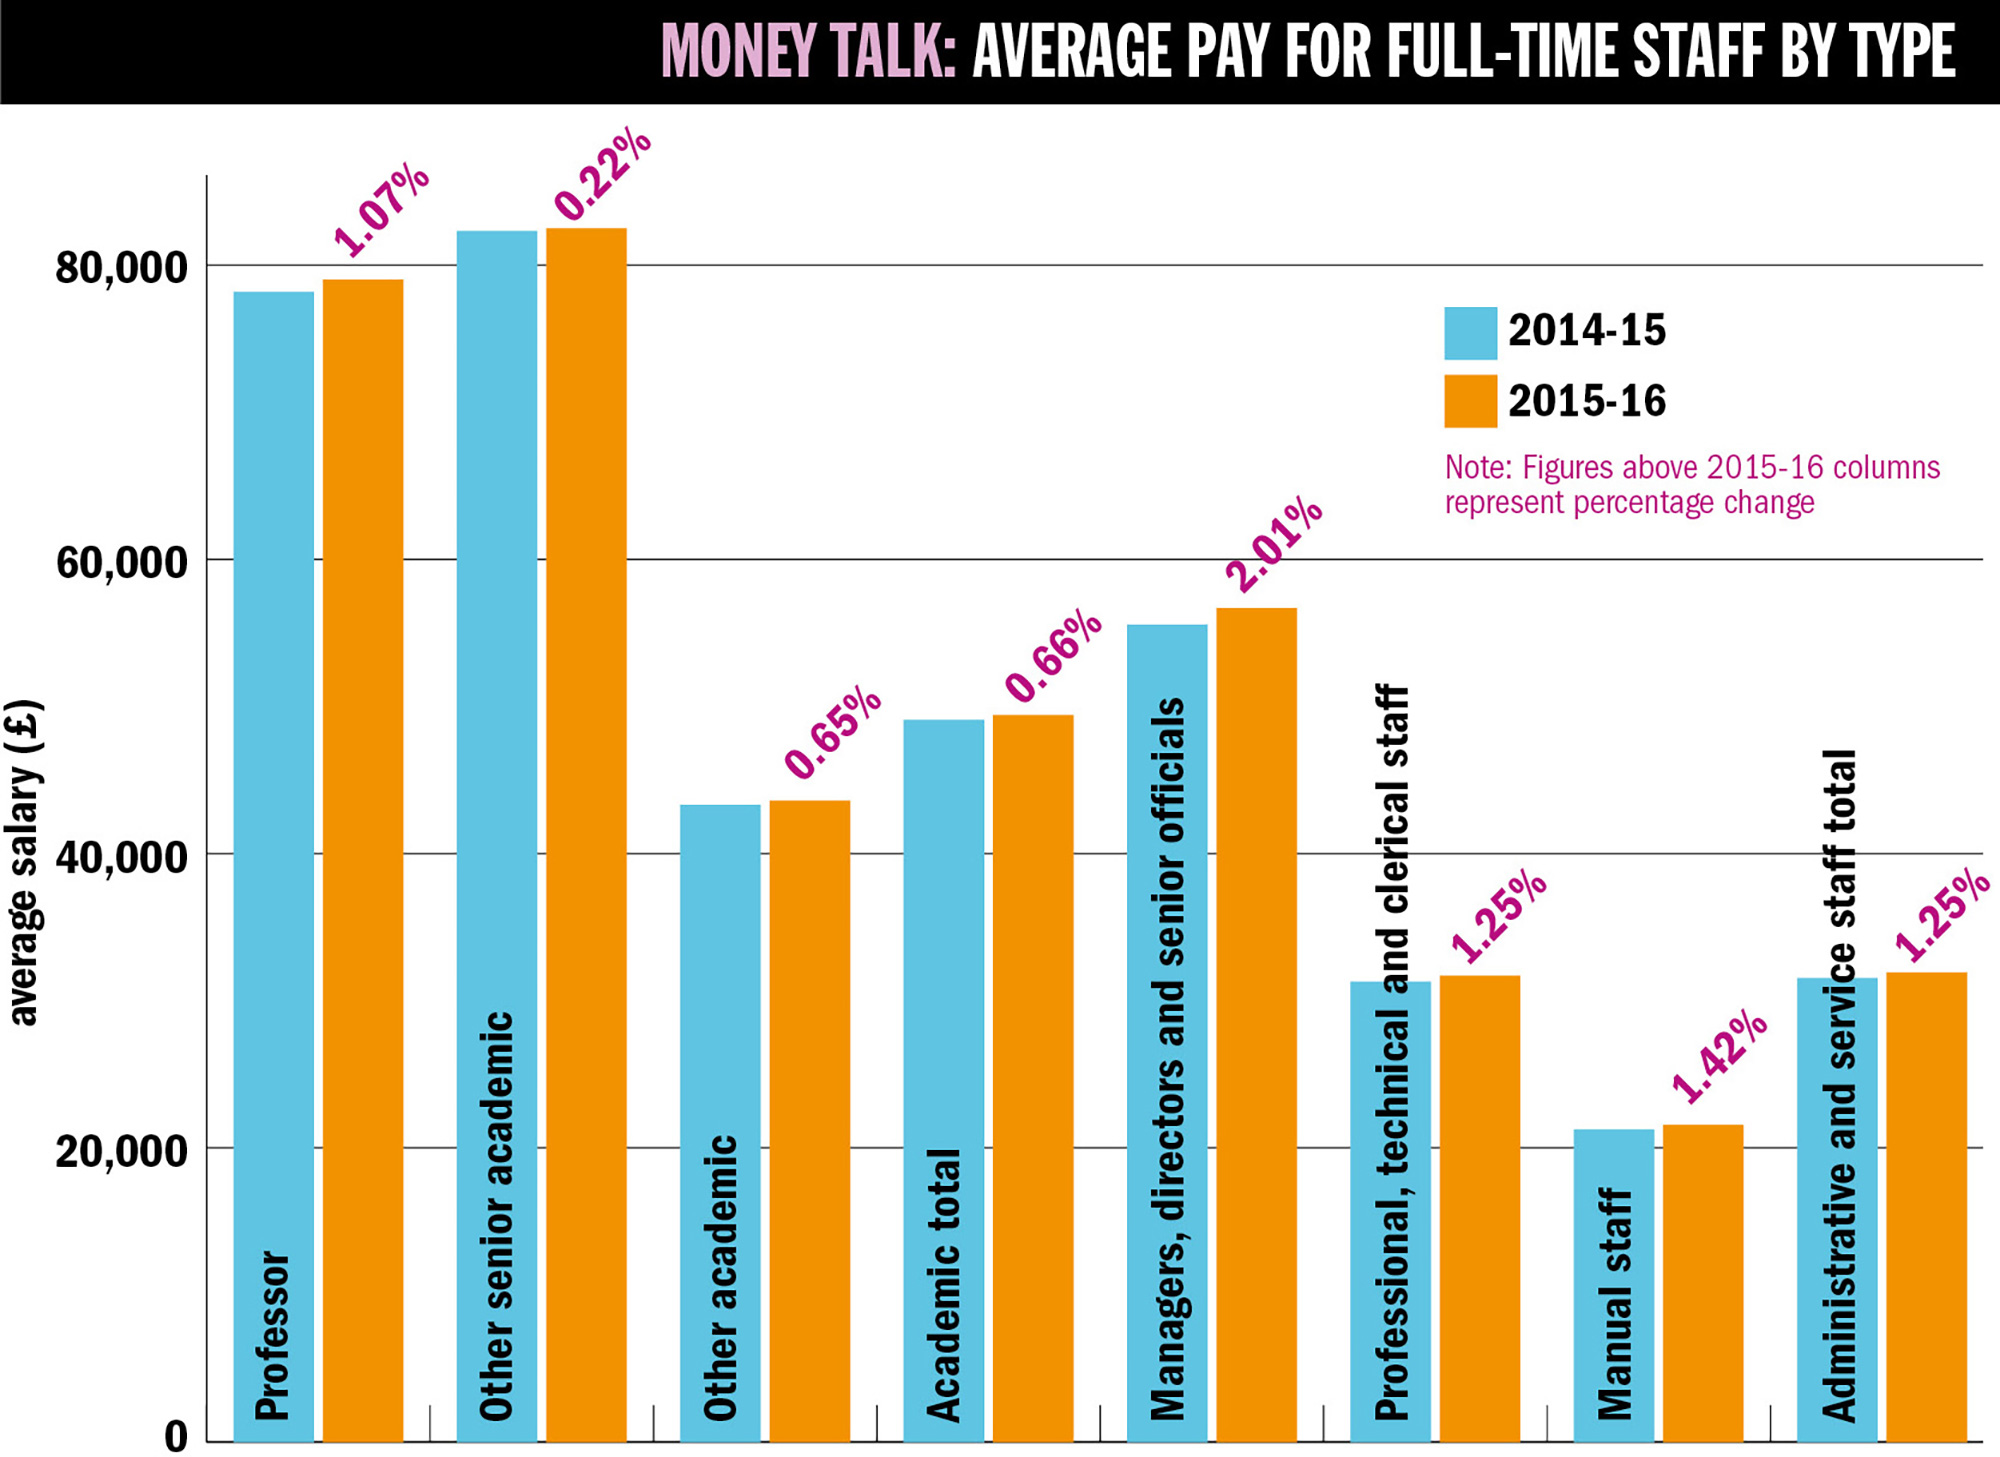
Note: Figures above 2015-16 columns represent percentage change
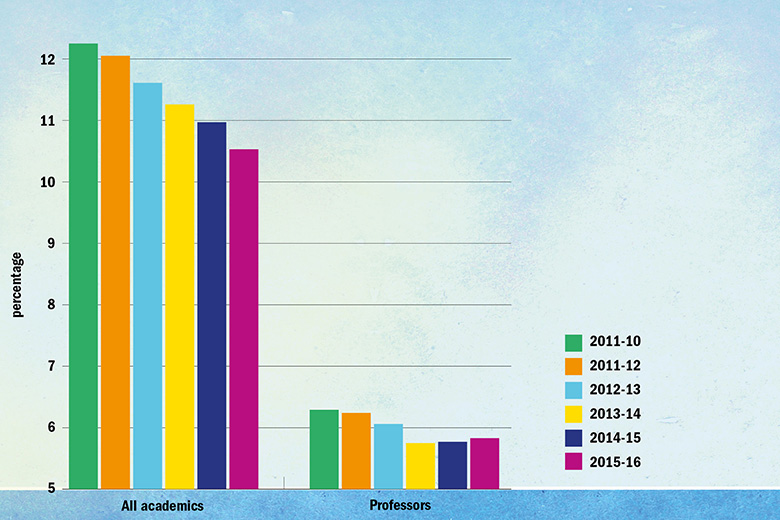
While the earnings of rank-and-file university staff are always a major bone of contention, the other issue that has dominated the pay agenda in recent years is the gap between the salaries commanded by men and women. So what do the Hesa data reveal about how well universities are addressing this problem? At first glance, the picture is mixed: the closing of the gender pay gap at the professorial level appears to have stalled. It nudged up very slightly in 2015-16 to 5.83 per cent after also rising the year before. But the pay gap between male and female professors is still smaller than that for academics overall: the latter figure was 10.5 per cent in 2015-16, meaning that women’s average salary was 89.5 per cent of men’s. But the gap across all ranks of academics has been continuously falling since 2010-11, when it was 12.3 per cent.
Conversations with universities, pay equality experts and academics suggest that there is no lack of will to tackle the gap, so the apparent stubbornness of the professorial figures may be disappointing. But there could be a number of factors explaining this, one being that more women are being promoted to professor level, but are initially starting on a lower pay band than the professorial average.
Fairfoul says it is certainly possible that a university could be making “genuine progress” on the issue despite the data showing “counter-intuitive” results. She adds that she is aware of one example where an institution had taken “very considerable steps” in encouraging women to apply for promotion “and actually they’ve identified that their professorial pay gap has gone up because they’ve got more new-entry female professors”.
Ucea also points to different measures of the gender pay gap: it says looking at the median salary shows that it fell 5.5 percentage points to 5.7 per cent for all academic staff in the 10 years to 2014-15.
Ellen Pugh, policy programme manager at the Equality Challenge Unit, whose Athena SWAN awards have become a benchmark for universities trying to improve gender equality, says it is important to recognise that addressing gender pay gaps across an entire workforce will take time.
This, she says, is due to the problem of occupational segregation: the tendency to find more women working at either different ranks (known as vertical segregation, such as there being proportionally more female early career researchers than professors) or in different fields (known as horizontal segregation, such as fewer women working in engineering than in languages).
“That can take a long time to address, but the sector should be looking at ways it can tackle both types [of segregation],” says Pugh.
She adds that there are various methods: mentoring younger researchers to help them gain promotion; challenging stereotypes in terms of the fields in which women work; and ensuring that pay systems are transparent. But none of these are fast solutions. Couple this with a low turnover of staff at senior levels and it is clear why the gender pay gap will not disappear overnight.
Gender pay gaps
Mind the gap: top 10 highest gender pay gaps for full-time professors
|
Institution |
Average female salary |
Average |
Gender pay gap |
Gender pay gap (%) |
|
£69,910 |
£81,708 |
£11,798 |
14.44 |
|
|
Brunel University London |
£73,786 |
£85,424 |
£11,638 |
13.62 |
|
£65,210 |
£75,079 |
£9,869 |
13.14 |
|
|
£65,908 |
£73,720 |
£7,812 |
10.60 |
|
|
£88,932 |
£99,375 |
£10,443 |
10.51 |
|
|
£70,638 |
£78,591 |
£7,953 |
10.12 |
|
|
£69,500 |
£77,235 |
£7,735 |
10.01 |
|
|
£71,451 |
£79,004 |
£7,553 |
9.56 |
|
|
£73,143 |
£80,757 |
£7,614 |
9.43 |
|
|
£62,589 |
£68,836 |
£6,247 |
9.08 |
Note: Small and specialist institutions excluded.
Far from equal: top 10 highest gender pay gaps for full-time academics
|
Institution |
Average female salary |
Average |
Gender pay gap |
Gender pay gap (%) |
|
£45,217 |
£54,483 |
£9,266 |
17.01 |
|
|
£47,034 |
£56,542 |
£9,508 |
16.82 |
|
|
£40,914 |
£48,729 |
£7,815 |
16.04 |
|
|
£45,934 |
£54,454 |
£8,520 |
15.65 |
|
|
£45,183 |
£53,413 |
£8,230 |
15.41 |
|
|
£57,704 |
£68,161 |
£10,457 |
15.34 |
|
|
£41,942 |
£49,505 |
£7,563 |
15.28 |
|
|
£46,145 |
£54,423 |
£8,278 |
15.21 |
|
|
£45,112 |
£53,145 |
£8,033 |
15.12 |
|
|
£43,579 |
£51,168 |
£7,589 |
14.83 |
Note: Small and specialist institutions excluded.
One university where impatience for change led to a more radical approach is the University of Essex, which last year took the decision to bring pay for female professors immediately into line with their male counterparts with a one-off pay rise.
The university’s director of human resources, Susie Morgan, admits it was a “quick and dirty” fix that was not ideal. But Essex had reached the conclusion that the problem “would take much longer to solve than we were prepared to wait”. She adds that the challenge now is to address all the other factors influencing women’s pay so that the gap does not open up again.
For example, the institution has attempted to avoid the problem of lots of relatively new female professors skewing the pay figures by also appointing experienced senior researchers from outside Essex. That also ensures “we have got role models for [female] lecturers and senior lecturers”, Morgan says.
The scale of the problem at sector level is clear when you consider that average male pay for professors is higher than average female pay at 79 out of 94 institutions in the analysis. And universities will soon be scrutinised like never before on this issue since most of them will be covered by a new law that obliges all large organisations to publish their gender pay gaps by the spring of 2018. Some are likely to publish earlier than others, but the Hesa figures already suggest which universities may have the most ground to make up.
Focusing on professors, some of those with the highest pay gaps appear to be heading in the wrong direction. For instance, the pay gap at City, University of London, rose 1.5 percentage points to 10.5 per cent in 2015-16. At Swansea University it went up 1.3 percentage points to 13.1 per cent and, at Royal Holloway, University of London, it went up a percentage point to 10 per cent.
Royal Holloway’s figure may prompt the most disappointment given that one of its female professors, Liz Schafer, took it to an employment tribunal in 2010 over equal pay – and its efforts to deal with the problem were recognised in last year’s THE Awards.
A spokeswoman for the institution says that although an independent equal pay audit in 2014 showed that there was no gender pay disparity for academics on the same grade, there “were fewer women in senior positions. Work continues to increase the number of senior female academics and therefore close the average pay gap.”
Top 10: professorial salaries
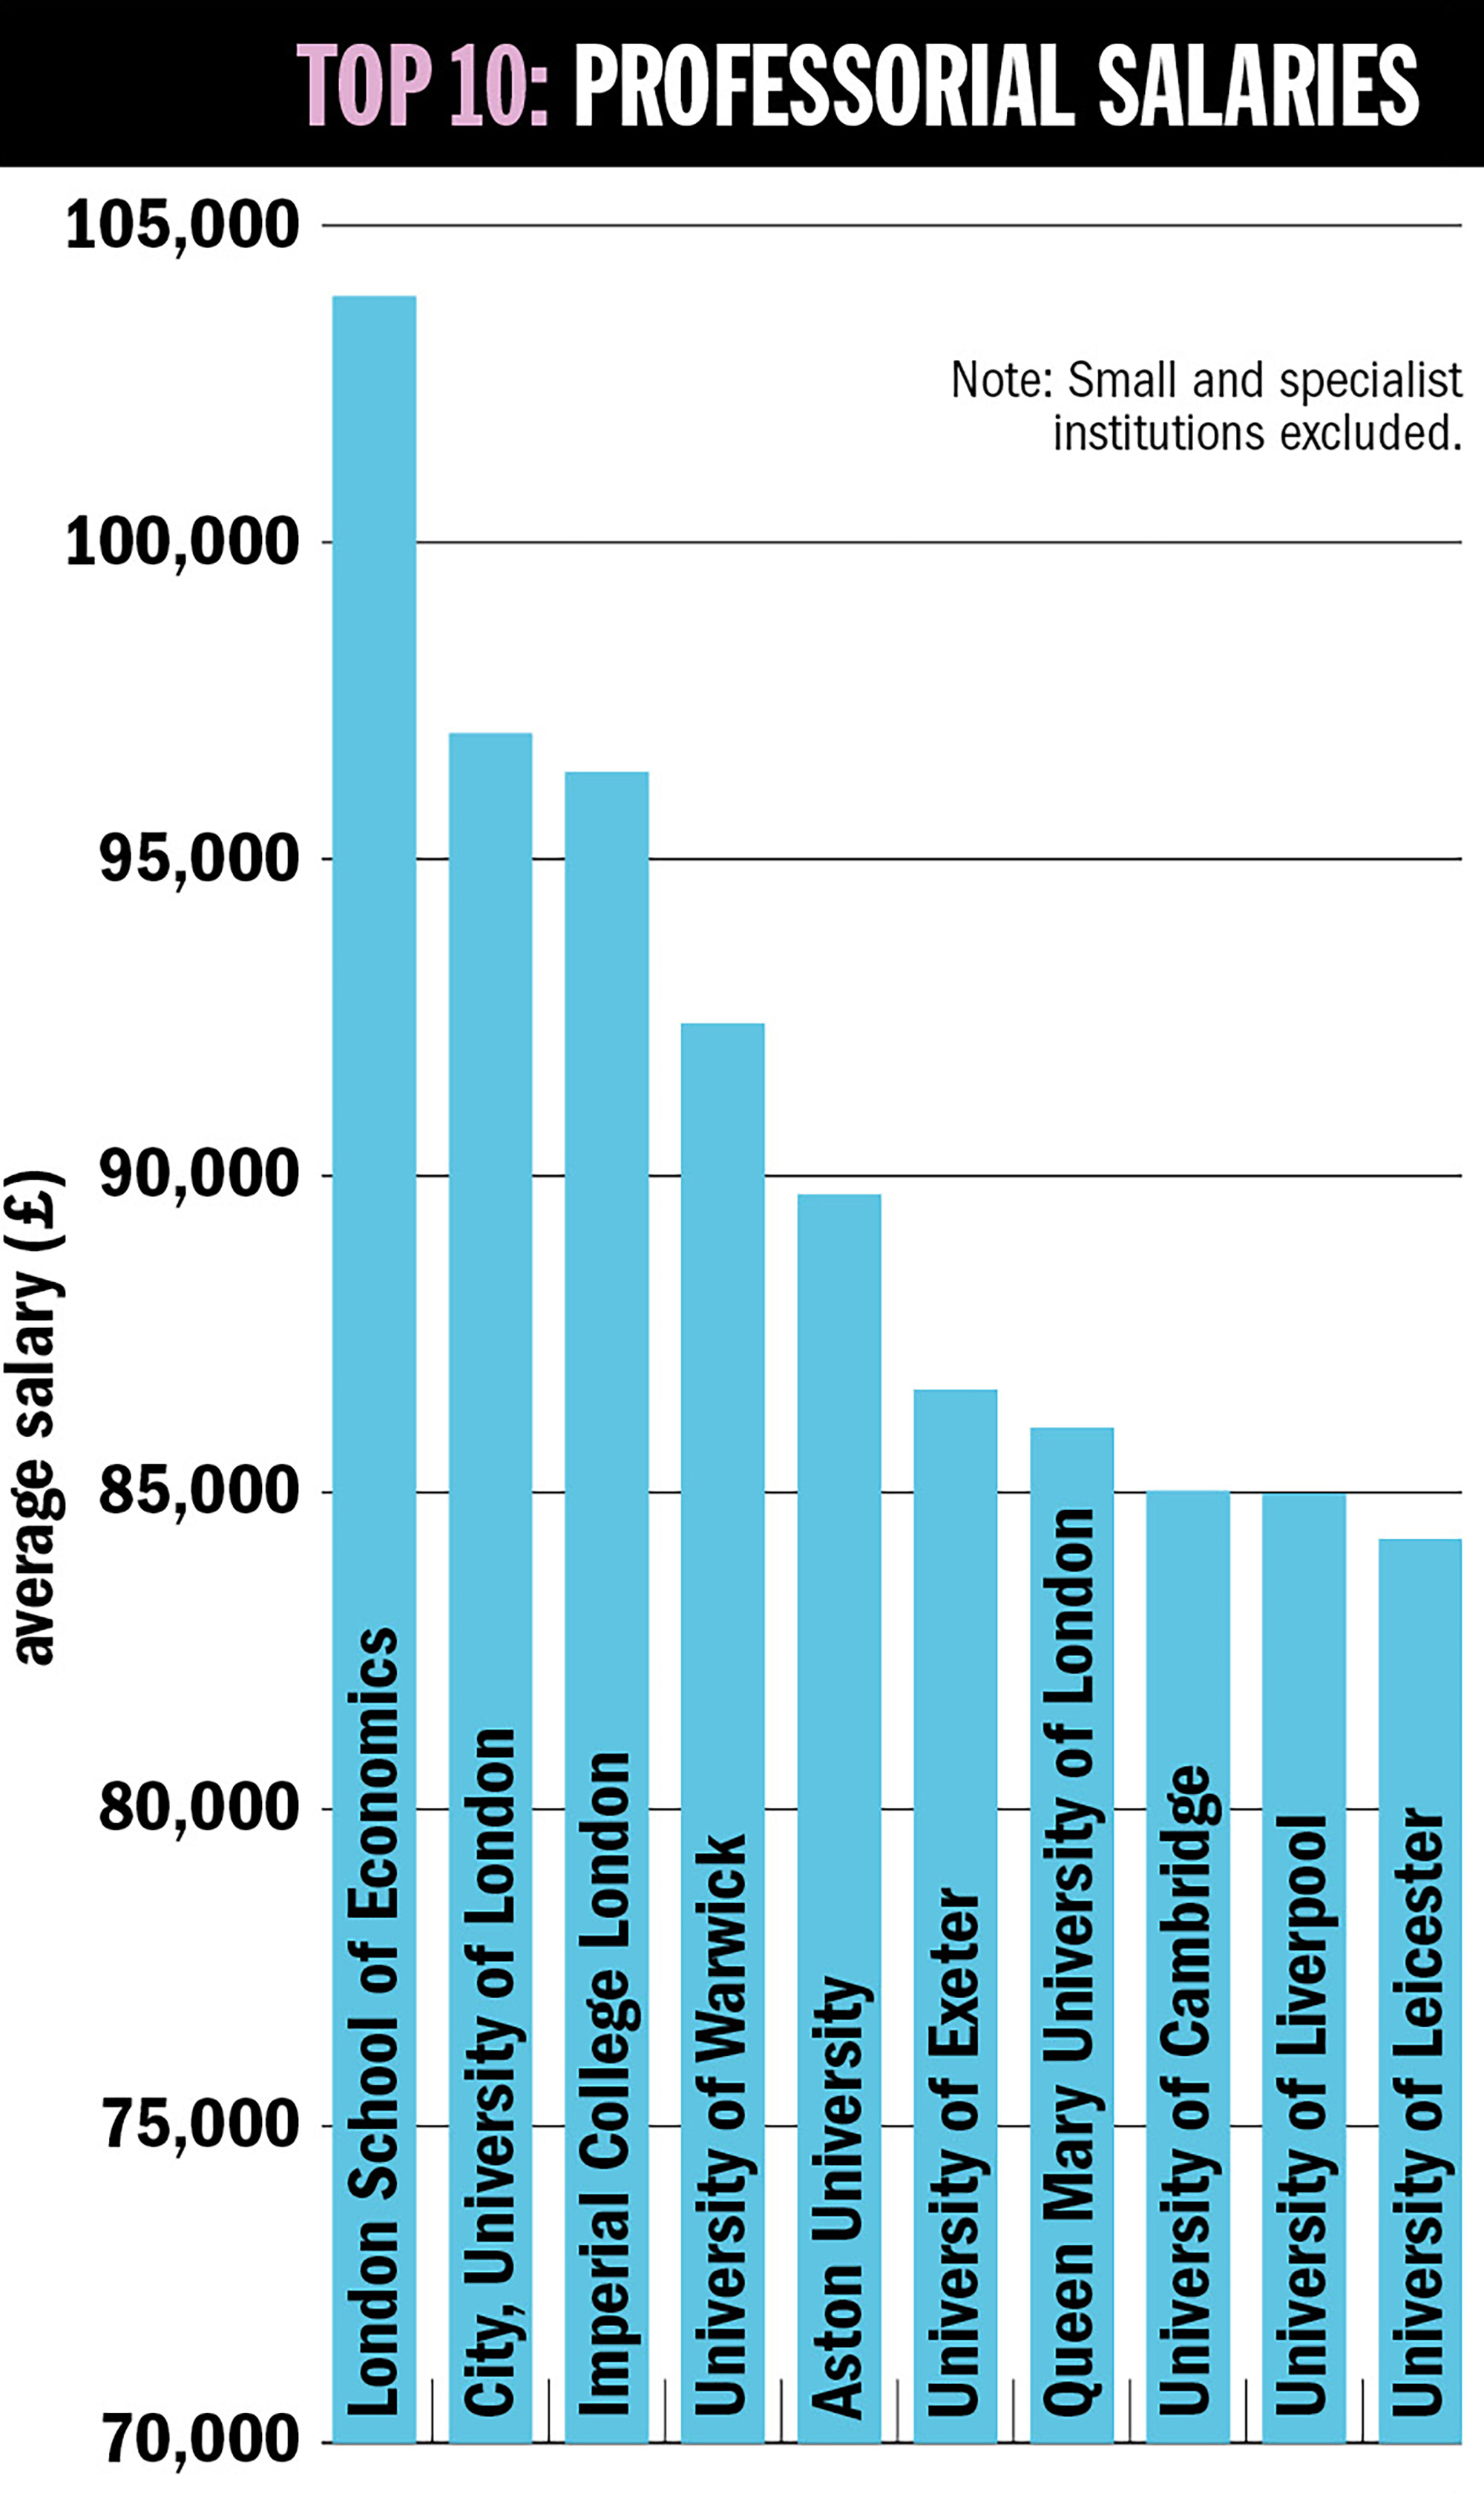
Note: Small and specialist institutions excluded.
The UCU, for its part, wants to see universities close the gender pay gap by 2020. “It’s an ambitious target, but for too long university employers have been content to just acknowledge or analyse the pay gap,” says Hunt. “Now we want concrete action.”
While the debate about the gender pay gap is now firmly focused on the pace of action, any discussion of the pay gaps between university staff from different ethnic backgrounds is much less further advanced.
Part of the reason for this is that the data on gender are much richer. The much smaller number of black and ethnic minority staff – particularly among academics at a senior level – makes it difficult to drill down into the statistics without averages becoming skewed by the mix of types of employment, locations of universities and outliers in salary figures.
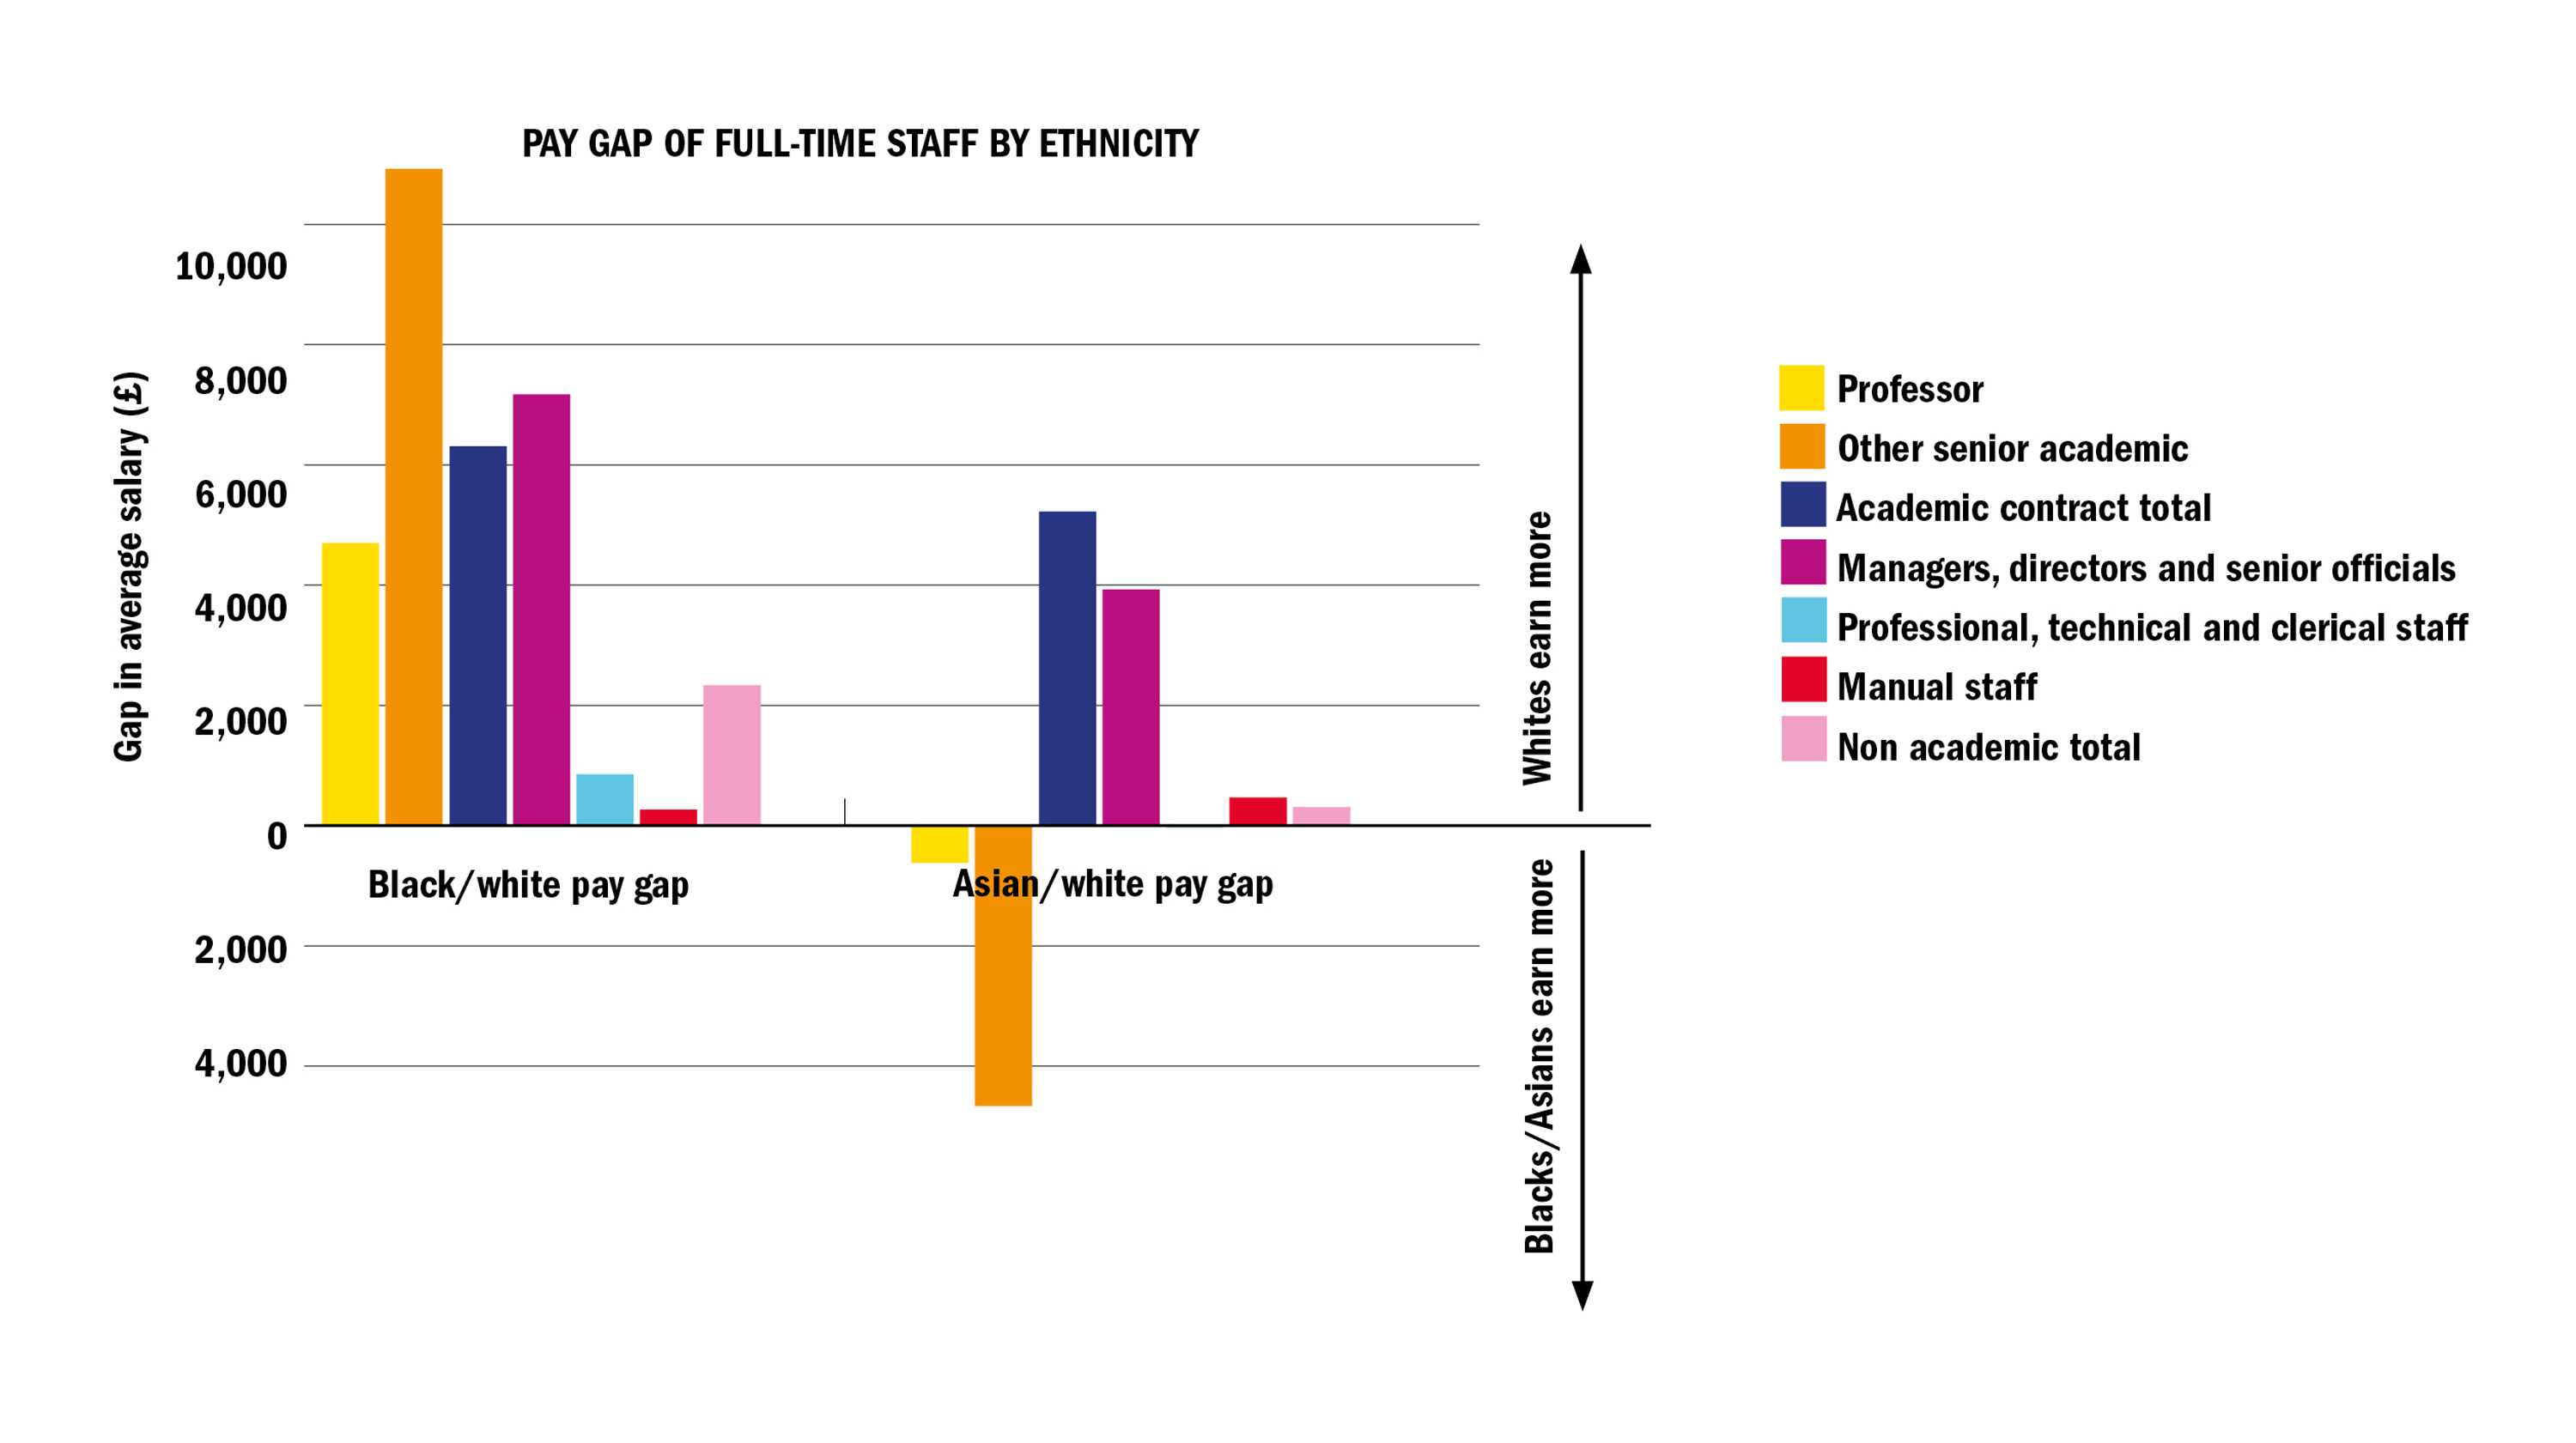
However, broadly speaking, some of the findings from the Hesa data make worrying reading. For professional and support roles, the overall average pay gap between black and white staff in 2015-16 was 7.3 per cent – rising to 12.6 per cent for senior administrative posts. Among academics, blacks were paid 12.6 per cent less than their white colleagues, while for academics of Asian ethnicity, the gap was 10.4 per cent. That is reflected in the fact that average pay for blacks is higher than for whites at just 21 out of 114 universities where the data can be analysed, while average pay for Asians is higher than for whites at 62 out of 132 institutions.
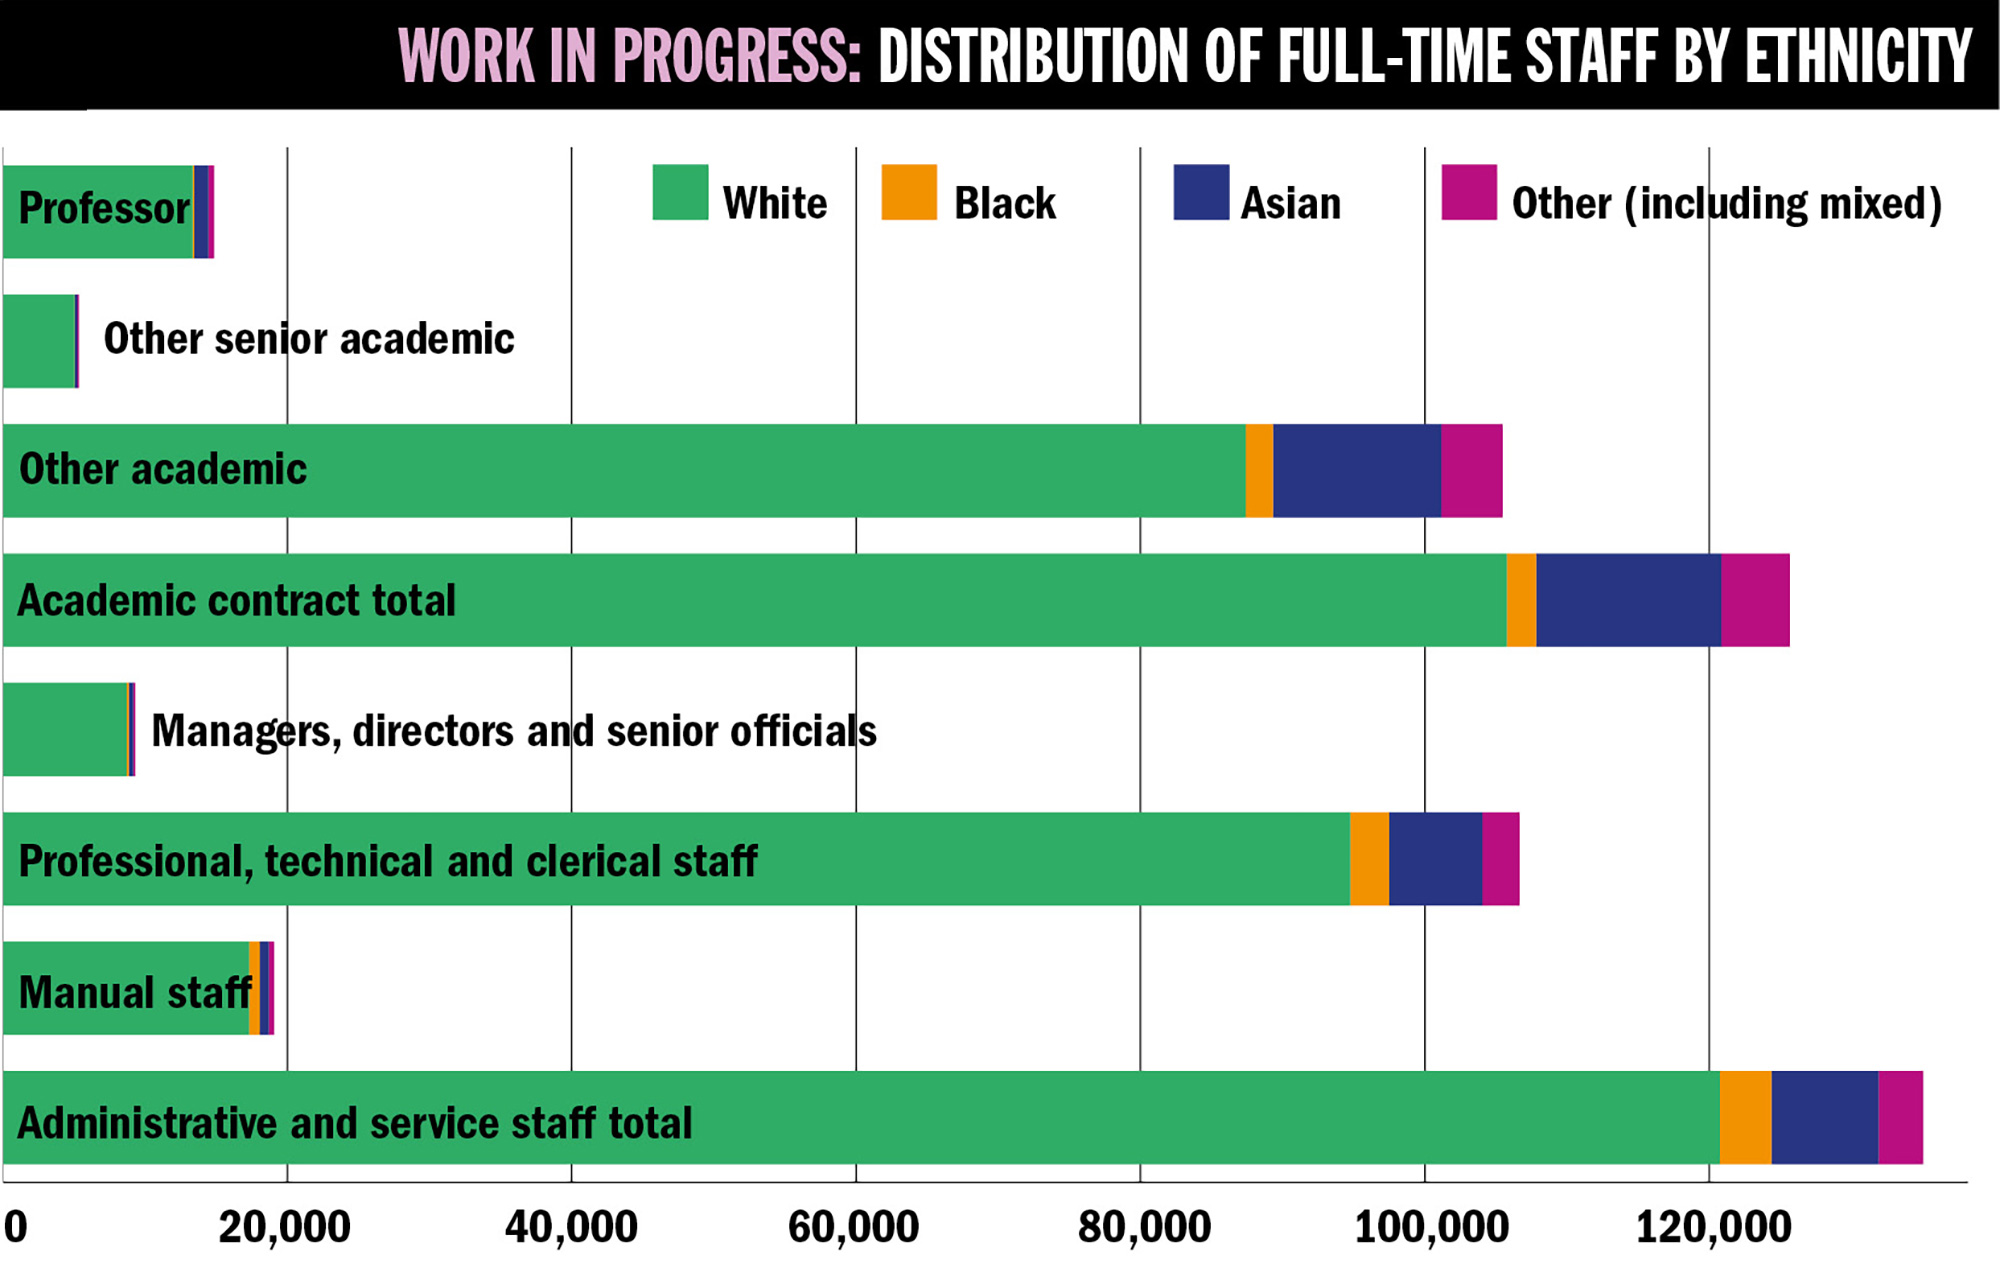
Perhaps most striking, though, is that for the most senior academic roles, including professors, Asian staff are actually paid more than their white colleagues while black academics endure pay gaps against white staff of 6.0 per cent for professors and 13.3 per cent for other senior academic jobs. The very small numbers of black staff at professorial level (95) and in the “other senior academics” category (30) have to be remembered when viewing the data. But this, in itself, identifies a serious problem.
Baroness Amos, director of Soas, University of London, who, in 2015, became the first black woman to lead a higher education institution in the UK, says the figures are “hugely concerning”.
“We need to ask ourselves why there is a lack of [black and minority ethnic] people in leadership positions at universities,” she says. “We have equality legislation, action plans and goodwill, but the real challenge is implementation, and we need to change the culture in HE.”
In her view, a “holistic” approach is needed that considers a range of factors beyond university campuses, including “the impact of social attitudes, stereotyping and discrimination”.
Distribution of universities' pay gap
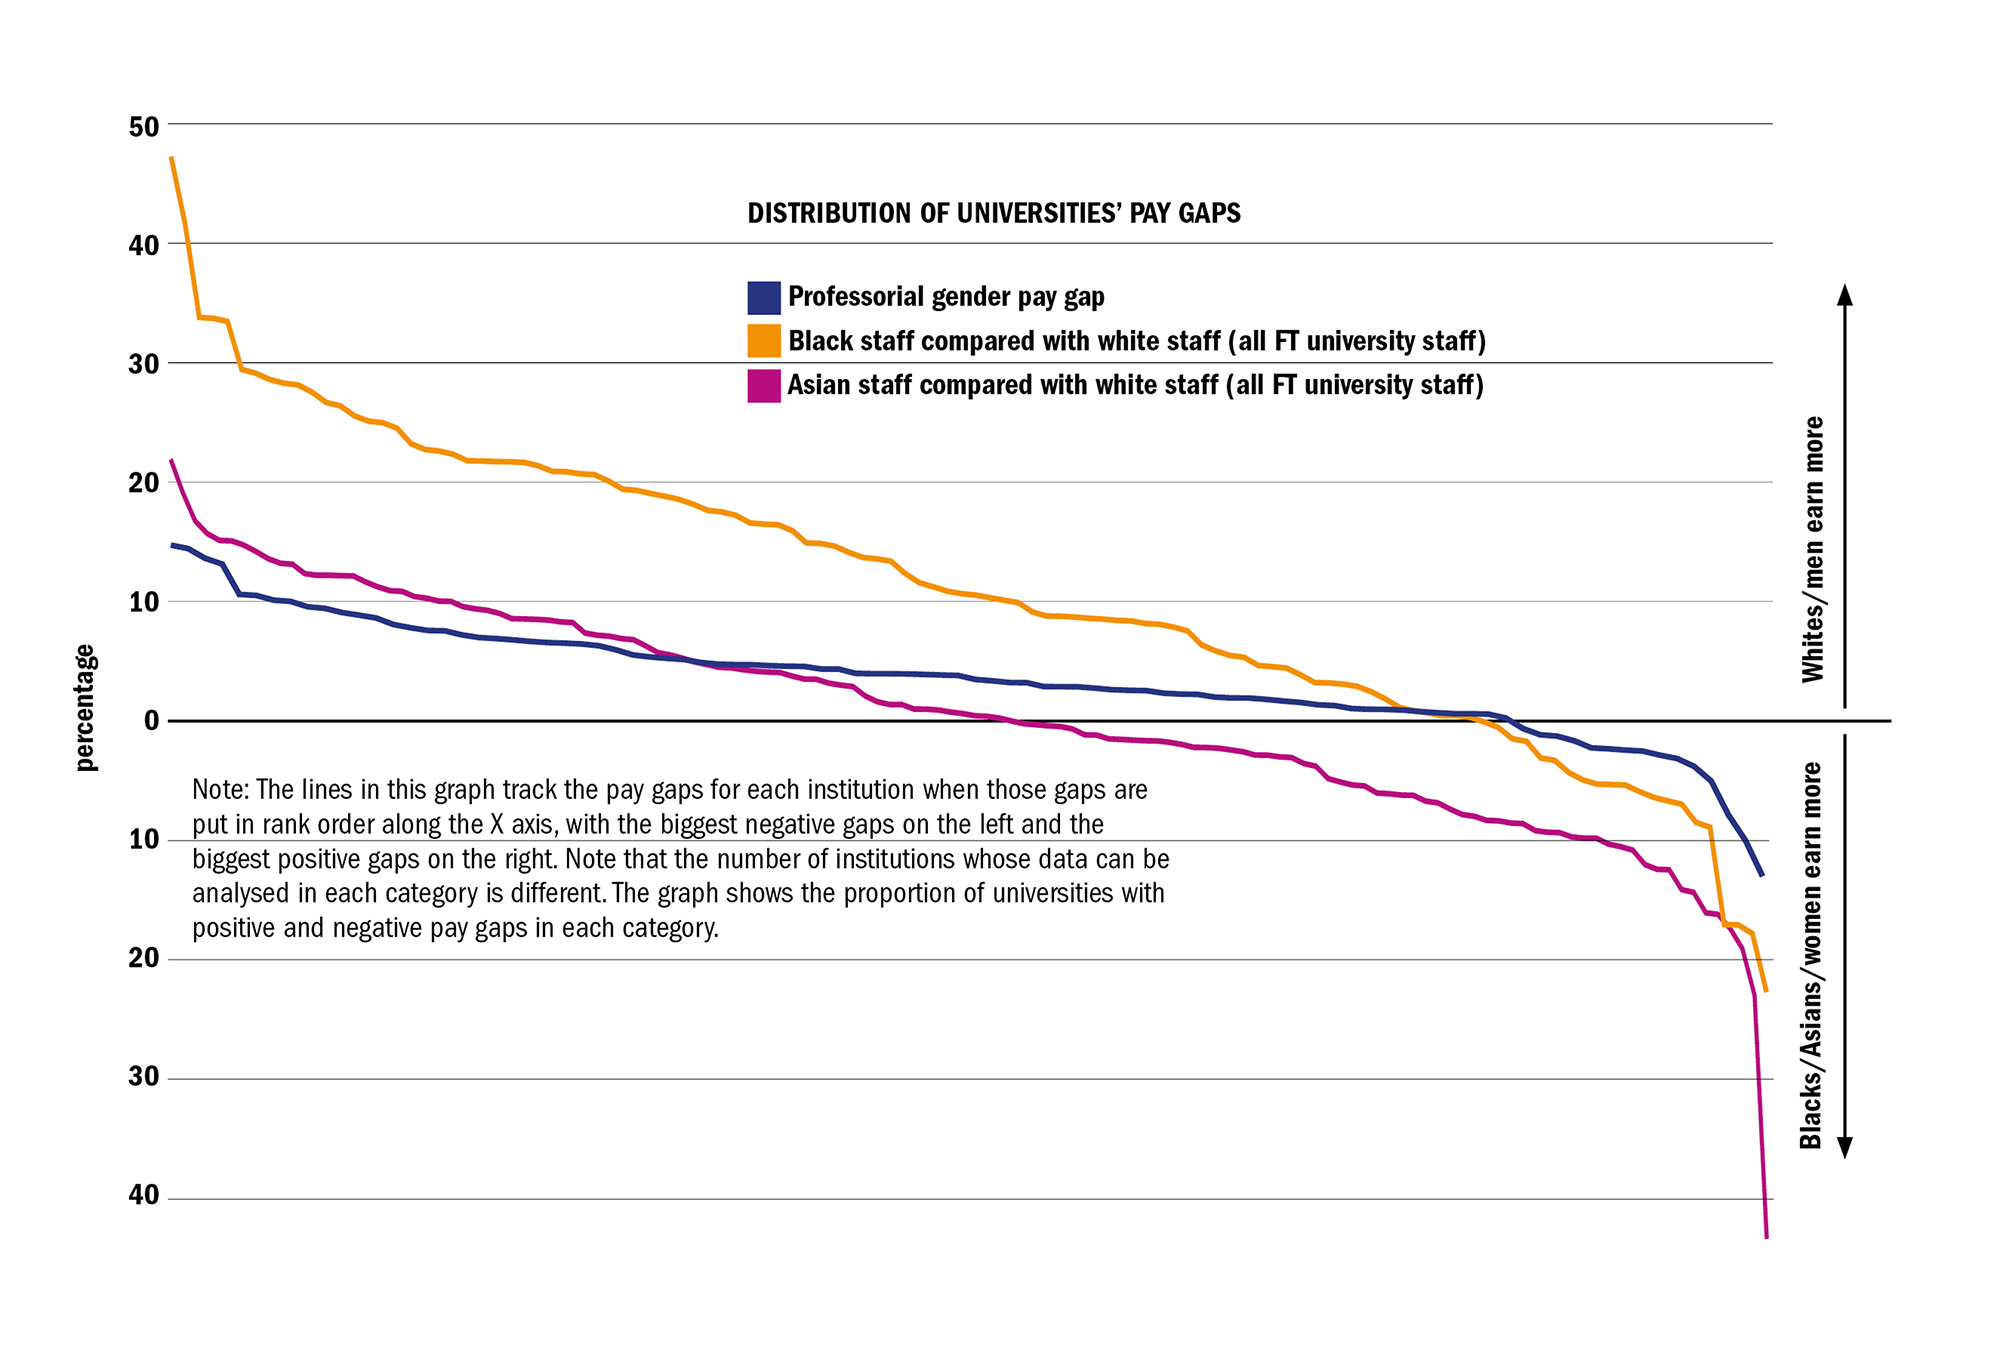
Note: The lines in this graph track the pay gaps for each institution when those gaps are put in rank order along the X axis, with the biggest negative gaps on the left and the biggest positive gaps on the right. Note that the number of institutions whose data can be analysed in each category is different. The graph shows the proportion of universities with positive and negative pay gaps in each category.
Pay gap of full-time staff by ethnicity
It is certainly true that many of the issues of occupational segregation that have made the gender pay gap so deep-rooted can also be found when looking at the racial pay gap. Pugh says, for example, that horizontal segregation can be seen through the clustering of more Asian academics in some highly paid fields, such as medicine.
The ECU has been attempting in recent years to create programmes to address the progression of BME staff in the same way as the Athena SWAN project addresses gender. Its Race Equality Charter now has 30 institutional members: a long way short of Athena SWAN’s 143, but it has been running for only just over a year, whereas Athena SWAN started in 2005.
Paul Miller, professor of educational leadership and management at the University of Huddersfield, who recently published research suggesting that BME academics can move up the ranks only if they receive tacit endorsement by white colleagues, says external quality schemes such as the ECU’s charter have to form part of the solution, but that universities needed to be self-critical too.
He identifies a number of specific reasons for the pay gap for black academics. These include their value “not being regarded as equivalent” to that of whites, and university managers “promoting those in their own likeness”, and he urges universities to assess themselves against benchmarks he sets out in his paper, “‘White sanction’, institutional, group and individual interaction in the promotion and progression of black and minority ethnic academics and teachers in England”, published in the journal Power and Education. Miller argues that while the solutions are never easy, “to ignore what is blatantly an inequitable and racialised pay structure is to be complicit with structural inequality”.
Work in progress: distribution of full-time staff by ethnicity
POSTSCRIPT:
Print headline: That sinking feeling
Register to continue
Why register?
- Registration is free and only takes a moment
- Once registered, you can read 3 articles a month
- Sign up for our newsletter
Subscribe
Or subscribe for unlimited access to:
- Unlimited access to news, views, insights & reviews
- Digital editions
- Digital access to THE’s university and college rankings analysis
Already registered or a current subscriber?