View the full results of the Times Higher Education v-c pay survey 2017 or search our interactive table below
After seeing their real-terms pay fall in recent years, the latest double-digit rises for some UK vice-chancellors are unlikely to elicit much sympathy among rank-and-file academics toiling away on their next grant application. Then again, who would want to be a vice-chancellor right now, facing all the challenges thrown up by Brexit, a prime minister hell-bent on slaying the international student cash cow, a pension liabilities time bomb and the dawn of the teaching excellence framework?
At first glance, Grant Thornton’s annual survey of leaders’ pay, compiled for Times Higher Education from universities’ annual financial statements, seems to suggest that, on average, remuneration in 2015-16 saw only a moderate increase compared with the year before. The overall cost of salary and benefits for vice-chancellors rose 2.5 per cent to an average remuneration of £257,904. When pension contributions are included, the rise was 2.2 per cent to an average of £280,877. This figure also includes universities where more than one leader was in office during the academic year, which can push up the average owing to factors such as severance payments and an overlap in salaries.
However, the figures do come after several years of higher increases; last year the average remuneration including pensions jumped 5.4 per cent, for instance. And 2.2 per cent is still more than double the 1 per cent national basic pay rise given to rank-and-file staff in 2015-16 – although the Universities and Colleges Employers Association says that the actual average increase received by staff on the national pay spine in 2015-16 was at least 2.6 per cent, due to pay progression and other factors.
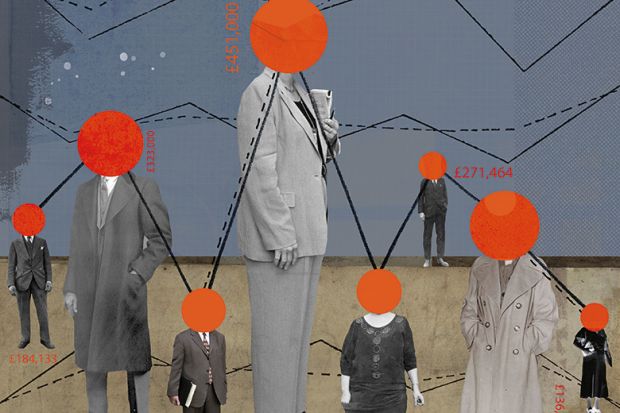
Looking beyond the headline rises for vice-chancellors also reveals the usual outliers that are bound to leave many staff at their institutions scratching their heads over how the remuneration committees that set senior pay arrive at their decisions. These outliers include the University of Bath, whose long-serving vice-chancellor, Dame Glynis Breakwell, has already received some media attention for a £45,000 (11.1 per cent) pay rise that leaves her as the best-paid university leader in the whole UK, with total remuneration, including pension, of £451,000.
In the money: top 10 highest-paid v-cs in 2015-16
|
Institution |
Vice-chancellor |
Total including pension |
|
Dame Glynis Breakwell |
£451,000 |
|
|
Sir Andrew Likierman |
£445,000 |
|
|
Alice Gast |
£430,000 |
|
|
Sir David Eastwood |
£426,000 |
|
|
Sir Steve Smith |
£426,000 |
|
|
Sir Keith Burnett |
£422,706 |
|
|
Edward Byrne |
£419,000 |
|
|
Craig Calhoun |
£413,000 |
|
|
David Latchman |
£392,287 |
|
|
Sir David Greenaway |
£381,000 |
Note: Excludes universities that paid more than one v-c in 2015-16
Other pay packages stand out for even higher percentage rises on the previous year, even if they are further down the list in terms of overall remuneration. At Bournemouth University, John Vinney’s total remuneration, including pension, went up by 19.6 per cent to £305,000 in 2015-16; Ulster University shelled out an extra 16.6 per cent for its vice-chancellor, Paddy Nixon, who joined just before the start of the academic year, and the University for the Creative Arts’ Simon Ofield-Kerr (who switched jobs to become deputy vice-chancellor at the University of the Arts London in January this year) saw his total pay package rise 18.7 per cent to £225,023 in 2015-16.
All this raises the question of what remuneration committees look at when setting pay. Do they simply look at similar “benchmark” universities? Are they looking at the sort of performance indicators that rank-and-file academics tend, rightly or wrongly, to be judged on these days, such as the research excellence framework and the National Student Survey? Or is strong and stable (to borrow UK prime minister Theresa May’s favourite phrase) financial management the main driver?
According to John Rushforth, executive secretary of the Committee of University Chairs – the UK association for governing bodies – remuneration committees “can’t simply mechanistically look at performance indicators when making an assessment of the pay of the vice-chancellor. They have to take a rounded view of all the factors affecting the institution in the context of their strategic plan and where they are seeking to take the institution.”
At the same time, there is no doubt that some key metrics will be carefully scrutinised by governing bodies, depending on the type of institution they are overseeing. Performance in the REF, which feeds into research funding levels for several years at a time, is bound to be a big consideration for research-intensives, for instance, while the shift to a market for students makes fee income, application levels and NSS performance particularly vital for teaching-led institutions.
Sure enough, analysis of the data reveals a strong correlation between vice-chancellors’ pay and the grade point average of their universities in the 2014 REF. On the other hand, this may simply reflect the fact that the highest-scoring institutions tend to be large research-intensives with an international reputation that will always attract the best-paid leaders.
V-c pay compared with REF 2014 score (research-intensives only)
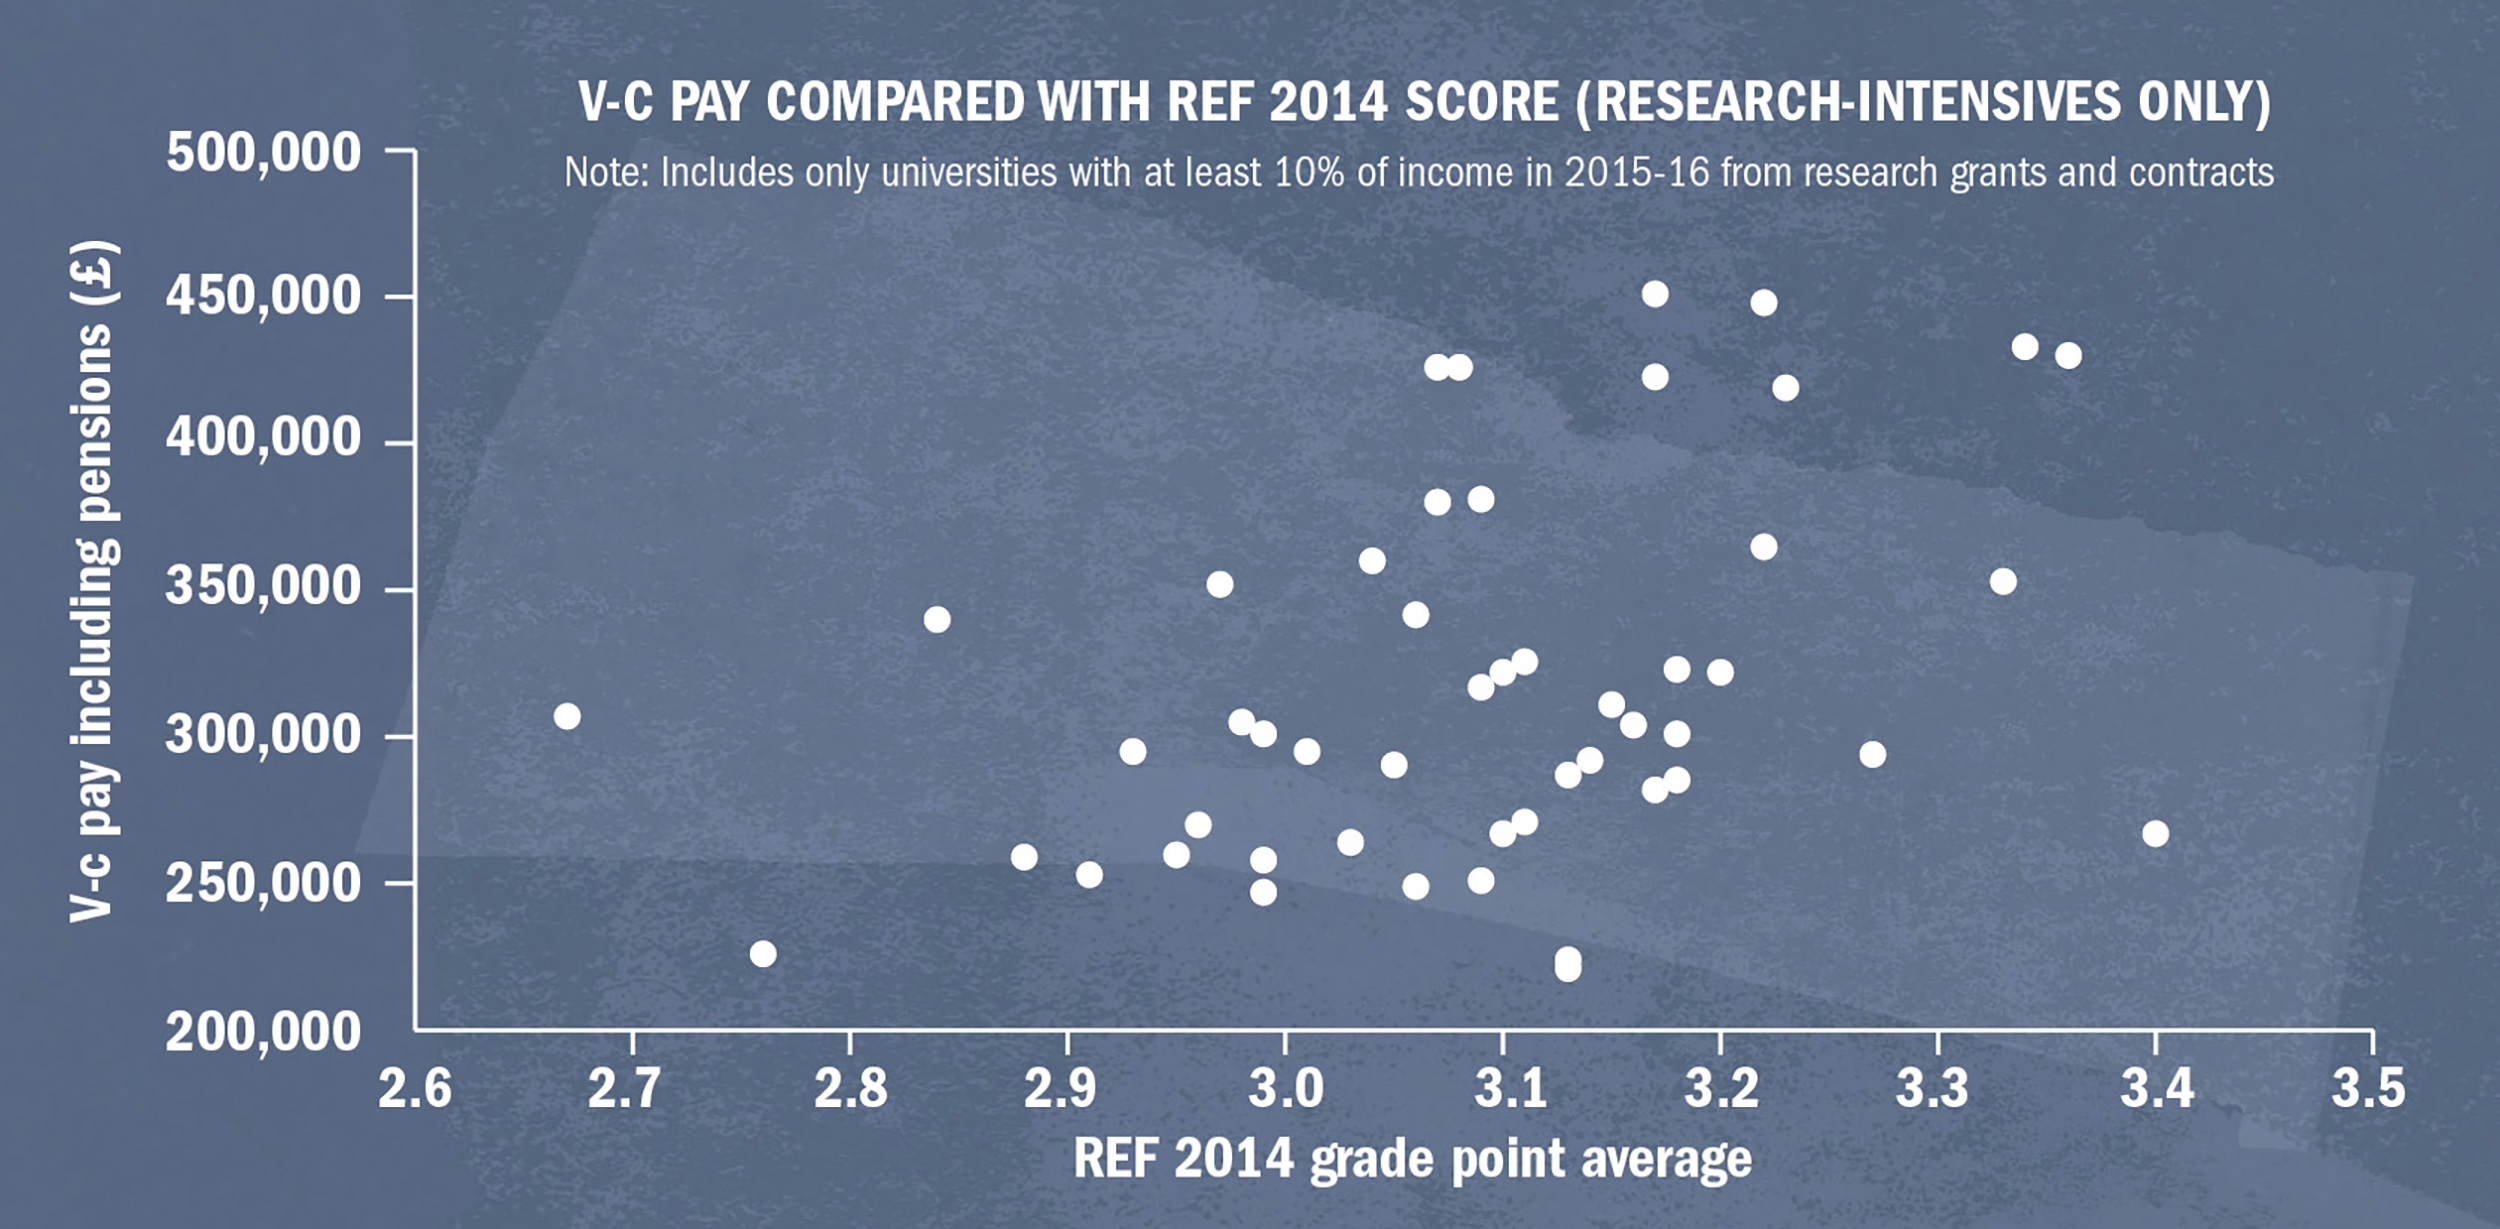
Note: Includes only universities with at least 10% of income in 2015-16 from research grants and contracts
Is there a similar pattern when looking at changes in student numbers or fee income? Universities such as Bath, where enrolments have grown in recent years, may point to this as one justification for boosting their leaders’ pay. But, on the other hand, there is little evidence of leaders’ pay growth slowing if student numbers head the other way. Taking the changes in fee income from 2014-15 to 2015-16 for universities where such money is a significant proportion of revenue and plotting this against vice-chancellor pay, reveals plenty of universities where income shrunk or stayed relatively static but remuneration remained high.
Change in fee income compared with v-c pay (teaching-intensives only)
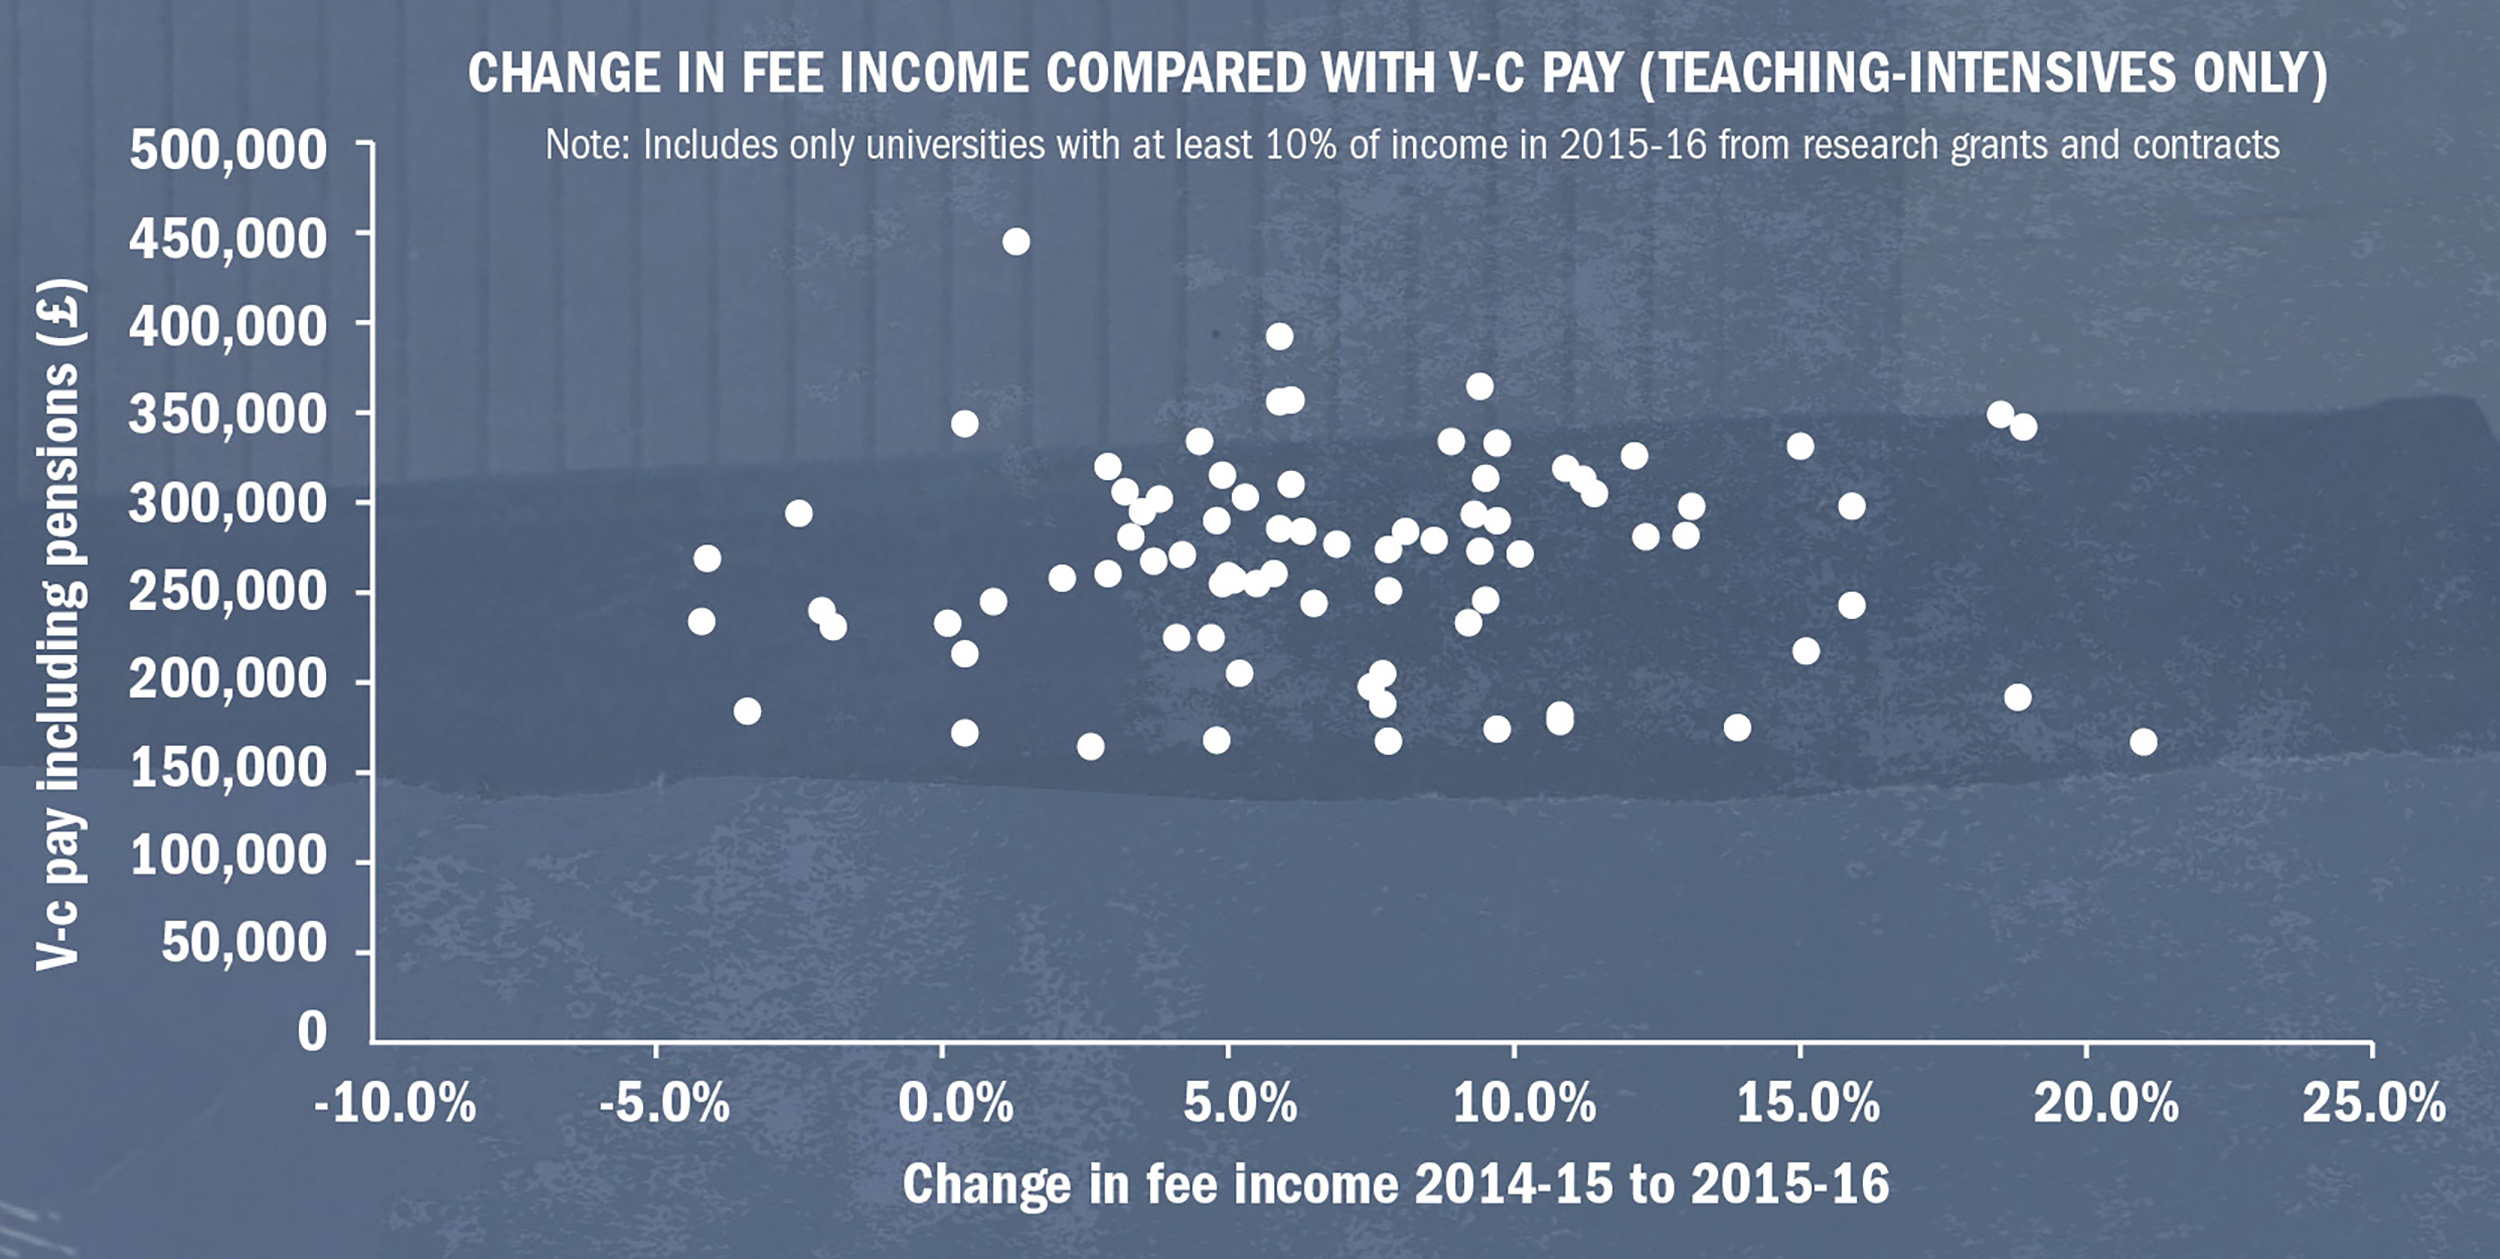
Note: Includes only universities with at least 10% of income in 2015-16 from research grants and contracts
Given the huge financial importance of student recruitment to universities in England and, to a lesser extent, in the rest of the UK, this does begin to raise questions about whether remuneration committees are playing by the same rules as some department heads around tying performance to results. Further analysis of student numbers reveals no discernible relationship between vice-chancellor pay and shrinkage of student numbers in the previous year.
Pay for v-cs where UK and EU student numbers fell
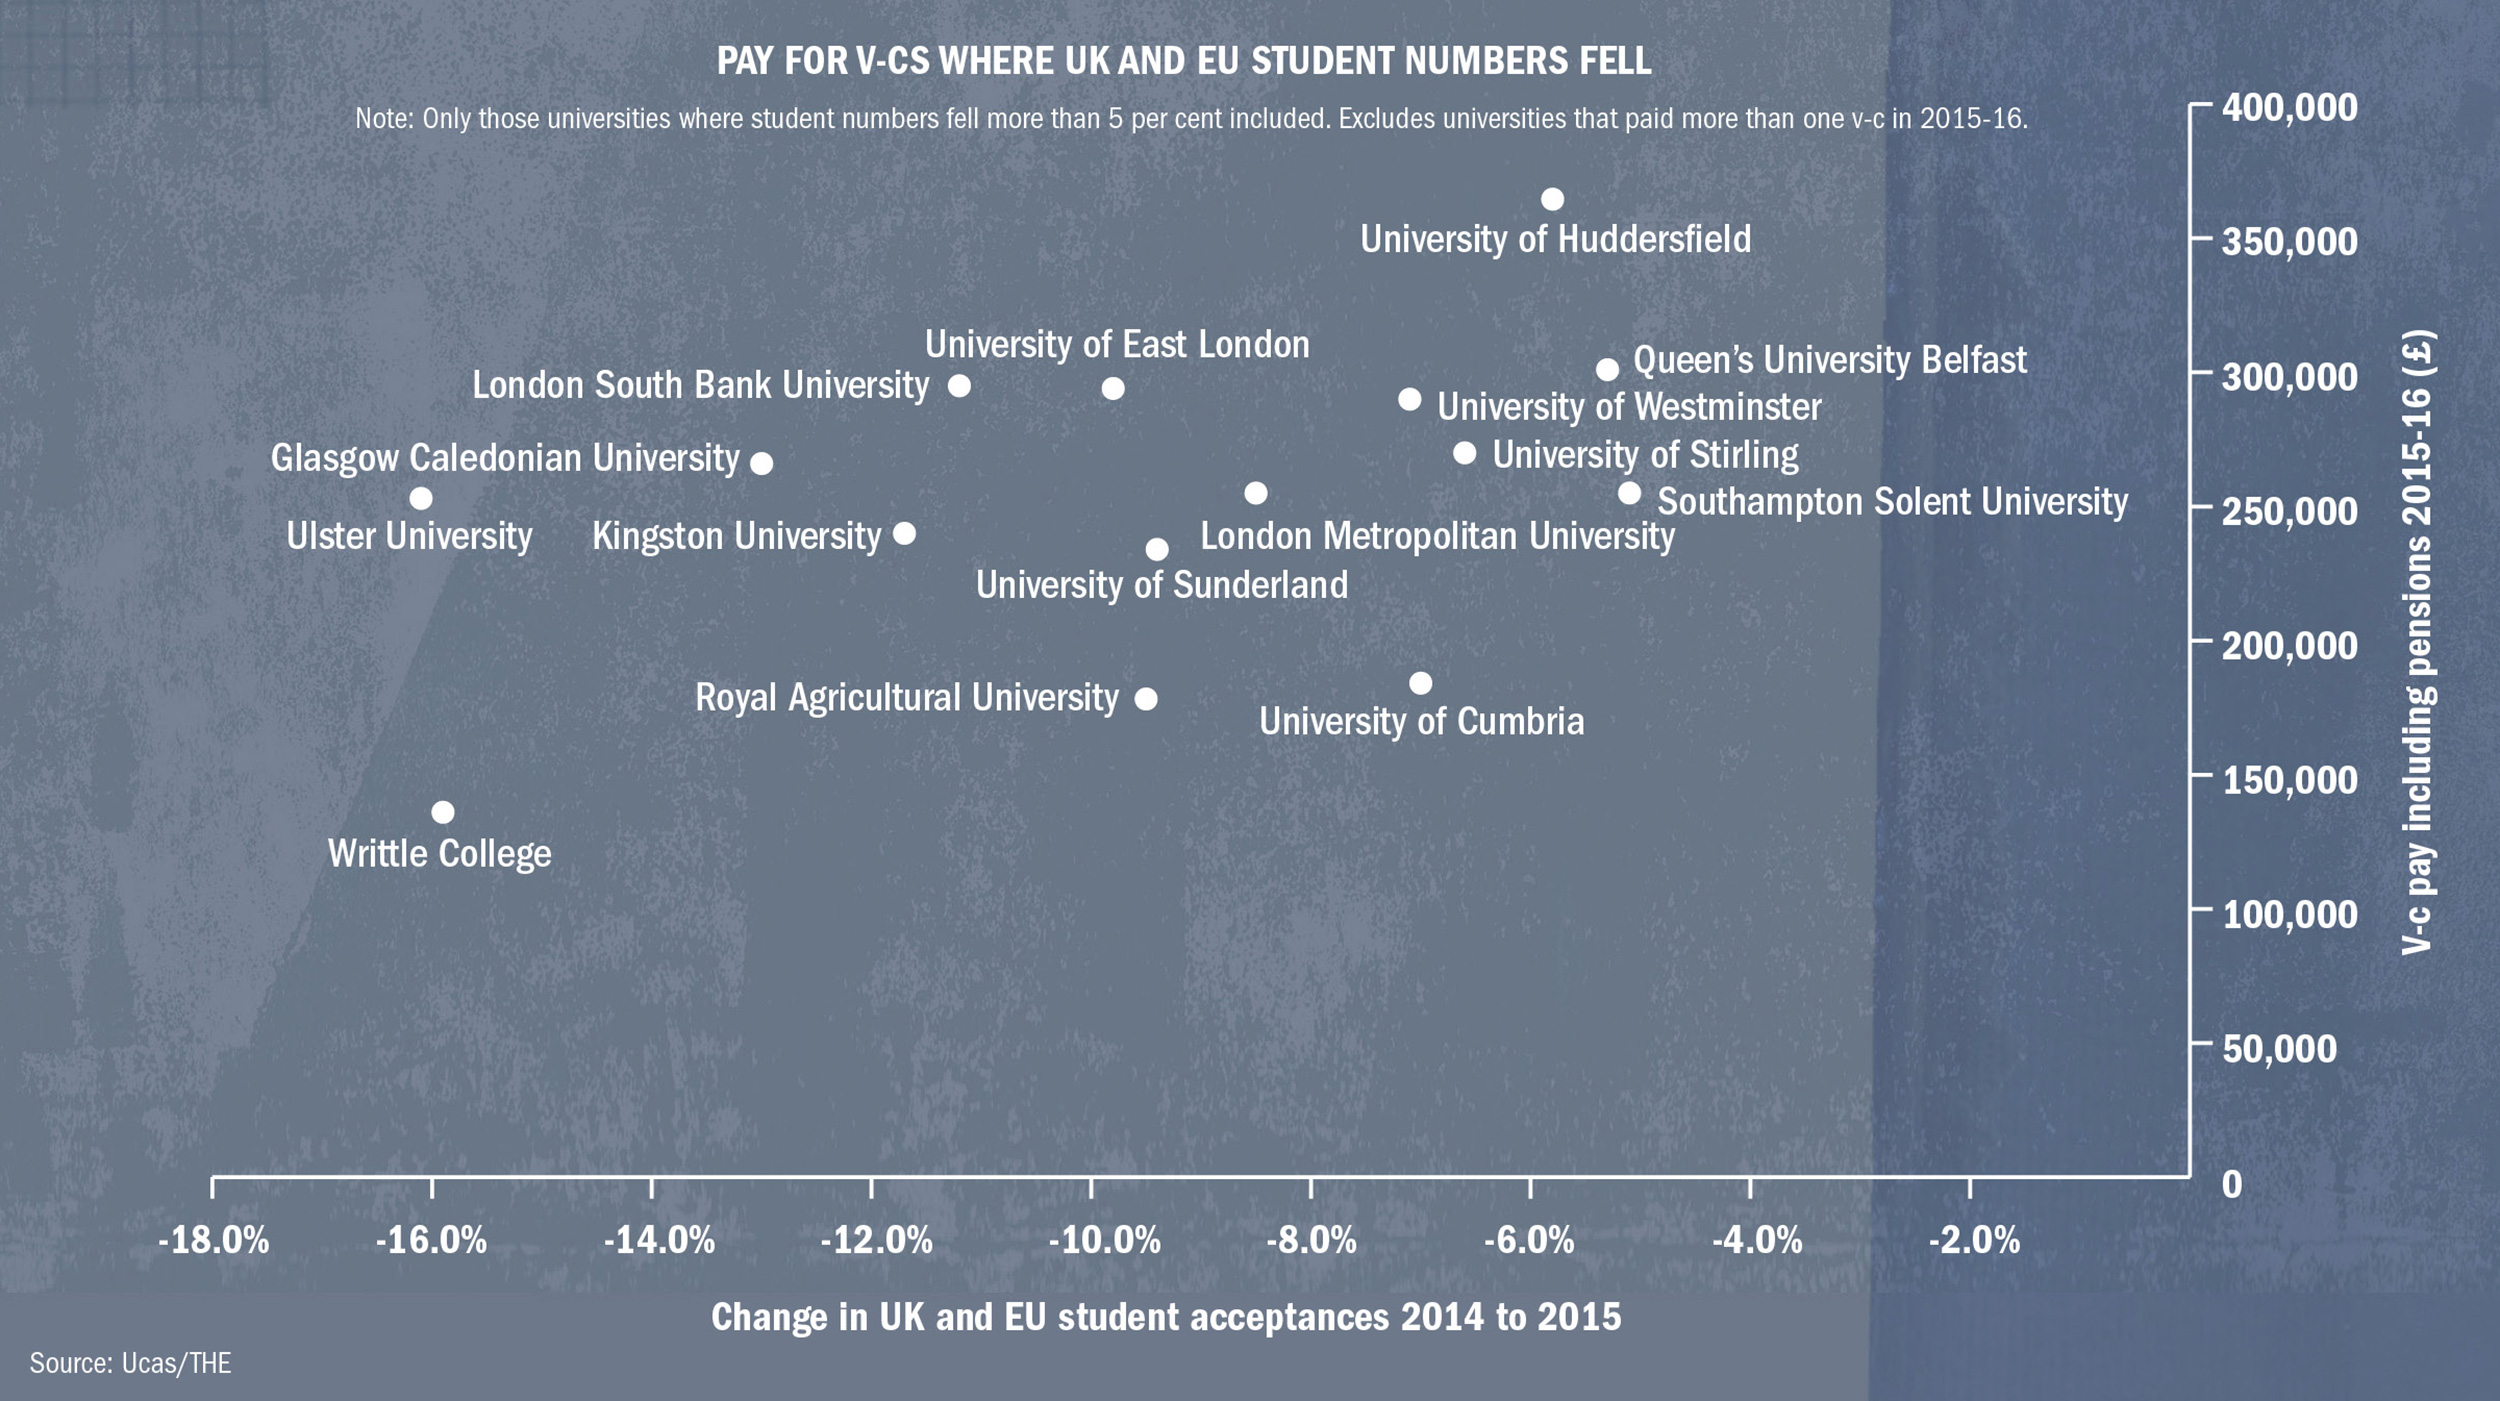
Source: Ucas/THE
Note: Only those universities where student numbers fell more than 5 per cent included. Excludes universities that paid more than one v-c in 2015-16.
Of course there are myriad reasons why student numbers can fall year-on-year. It may be a deliberate policy to raise entry standards, or it could be the result of an intrusive construction project that is important for long-term growth but that hits student satisfaction scores and, therefore, subsequent demand in the short term. But, on the latter point, the correlation between NSS scores and vice-chancellor pay appears to be stronger, so there is some indication that it is feeding into remuneration committees’ thinking.
V-c pay including pension compared with NSS score
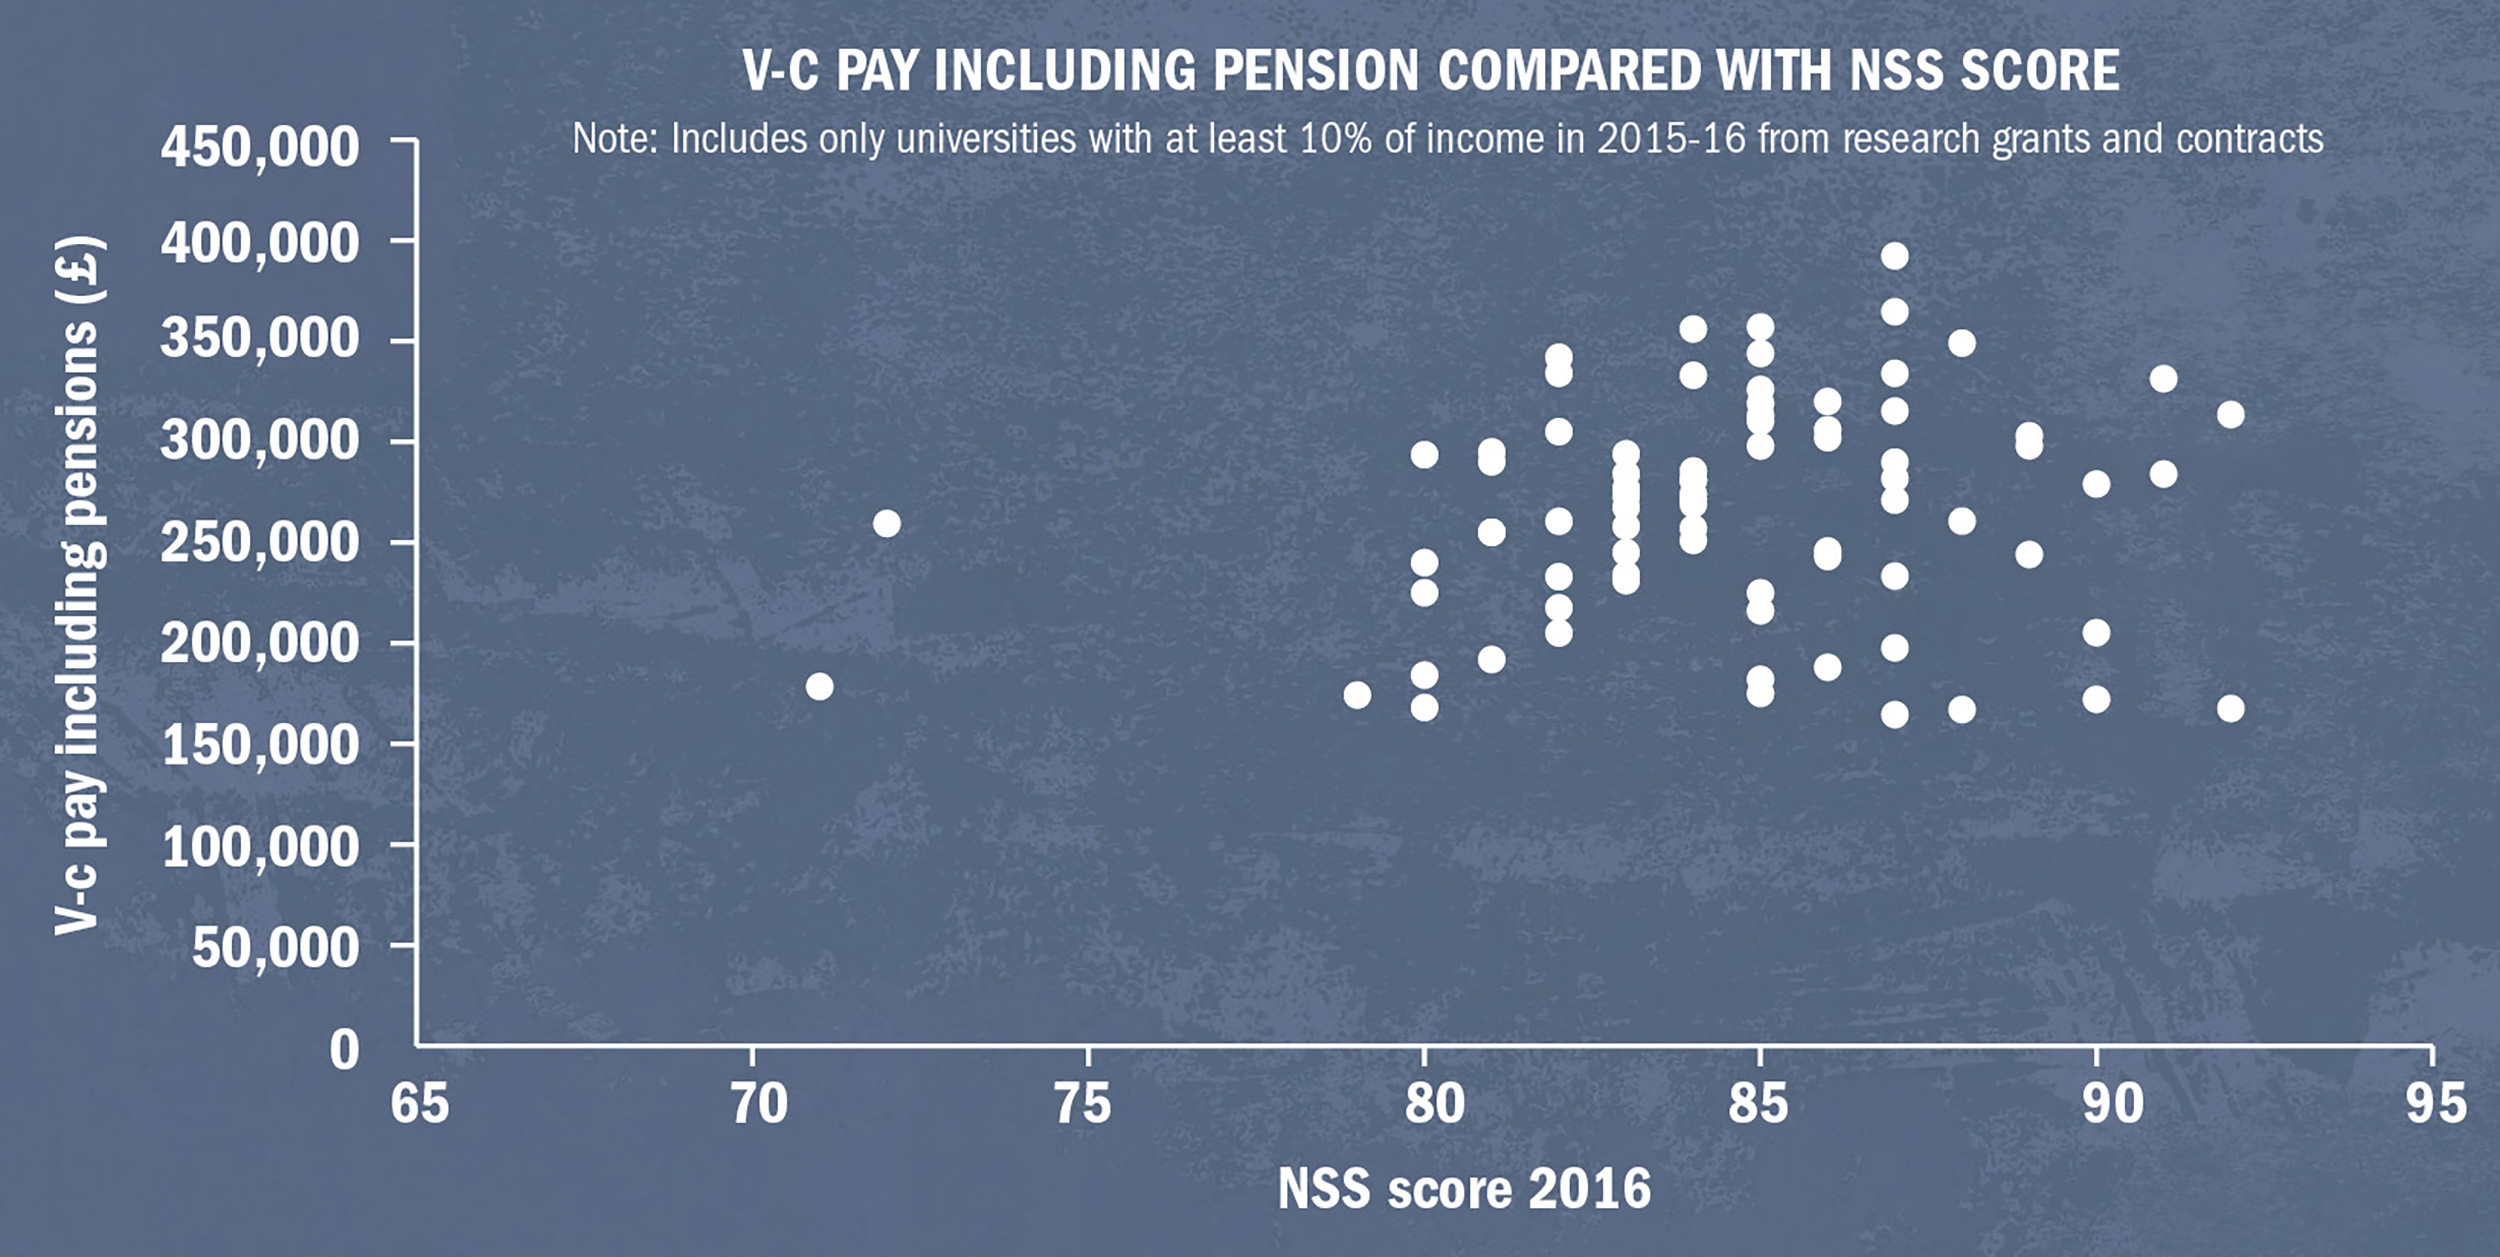
Note: Includes only universities with at least 10% of income in 2015-16 from research grants and contracts
Rushforth points out that a good governing body will have its eye on the long-term picture and will allow for the fact that a strategy itself may “generate changes and those changes might affect student numbers and individual metrics. The key point [is] transparency: committees should be able to justify the decisions that they make in the context within which the institution is operating.”
In addition, it would no more obviously be fair to cut a vice-chancellor’s pay for poor institutional performance than it would be to cut any other member of staff’s. According to Richard Shaw, head of education for Grant Thornton: “If there is poor performance at a university then it tends to pan out over a number of years and it is [only after such a period] that a governing body might make a decision about a vice-chancellor.” That decision, he adds, is more likely to be to push the v-c out of the job, rather than reduce their pay, while those taking their place need to be given time to turn things around.
But some universities that have seen lower student recruitment in recent years did award big pay rises in 2015-16. They include the University of East London, whose vice-chancellor, John Joughin, saw his total pay, including pension contributions, go up 13.5 per cent in 2015-16 despite the number of UK and European Union students placed at the institution by Ucas falling 10 per cent from 2014 to 2015. Another example is the University of Bolton, whose vice-chancellor, George Holmes, enjoyed a pay rise of 11.5 per cent while the institution’s recruitment was either static (in 2015) or falling (by 6 per cent in the year to 2016).
A UEL spokesman says that the increase in Joughin’s salary followed a period “in which there had been no change [in its level] for a number of years”, and its current level reflects “the complexity and difficulty of the job he undertakes”. Meanwhile, a Bolton spokesman says that Holmes has “overseen a dramatic turnaround in the fortunes of the university” since taking over a decade ago, creating a “strong financial platform from which it can confidently develop for the future”.
Both universities also make the point that their vice-chancellors’ remuneration is not out of line with similar institutions, and is lower than many. A similar point is made by other universities whose leaders’ pay stands out in 2015-16. When the news of Breakwell’s pay at Bath first hit the headlines in January, the university pointed to “her excellent track record”, and to the fact that her remuneration was “comparable with that of long-standing vice-chancellors in other successful universities”.
And among other universities that commented on pay figures within THE’s deadline, a spokeswoman for Ulster says that its vice-chancellor’s pay is “benchmarked against, and on a par with, other similarly-sized universities in the UK” while Bournemouth says that part of Vinney’s remuneration was “a non-consolidated performance related payment” and that “his basic salary remains in line with the average salary when compared across the sector”.
All of this suggests that, above all, benchmarking against other universities – and not scrutiny of performance metrics – is still the key mechanism in the setting of vice-chancellors’ pay. Shaw says that he believes this is still the central reason why most remuneration packages in the sector tend to converge around the same level, and he suggests that pay should be linked more closely to performance over the long term.
“What this sector lacks is the kind of long-term incentive plans that the private sector may have,” says Shaw. Such plans should be based, he says, on the aspirations set out in universities’ strategic plans, from which specific targets can be derived.
Some universities already purport to take such an approach, but one former vice-chancellor, who did not want to be named, says that, at present, targets in higher education “are opaque and often informal”. He also fears that performance-related pay could push vice-chancellors’ pay ever further out of whack with the pay of others at their institutions. “The peer group against which vice-chancellors should be judged are senior academics – which they were and often still are – not top managers in the private sector with casino-like ‘reward packages’,” the vice-chancellor says.
Many rank-and-file academics may also argue that benchmarking of their leaders’ pay would be fairer if it was done against the pay of staff within the same institution. In 2011, the economist Will Hutton, now principal of Hertford College, Oxford, was commissioned by the government to look into fair pay in publicly funded organisations. The final report of the Hutton Review of Fair Pay in the Public Sector identified universities as having the highest differential between their leaders and their lowest-paid employees. He suggested that a portion of chief executives’ salaries in the public sector should be at risk if they did not hit certain targets, while also calling for the ratios of leaders’ pay to median institutional pay to be published. At the time, Ucea said that publishing this differential would simply reveal higher education to be in line with the health service and local government, with a ratio of 6:1.
Figures for median pay levels within entire university workforces are not available. However, analysis reveals that, before benefits and pensions, vice-chancellors at about half of UK universities earned in the region of five times the mean salaries of all academic staff at their institutions in 2015-16. (At a national level, that latter figure was £49,408: considerably higher than the £31,934 average earned by professional and support staff.) However, such an analysis also flags up some outliers – of which the most striking, again, is Bath, whose vice-chancellor earned 8.7 times the mean salary of its academics (see graph, page 42).
Highest 10 pay ratios for v-c to average academic pay
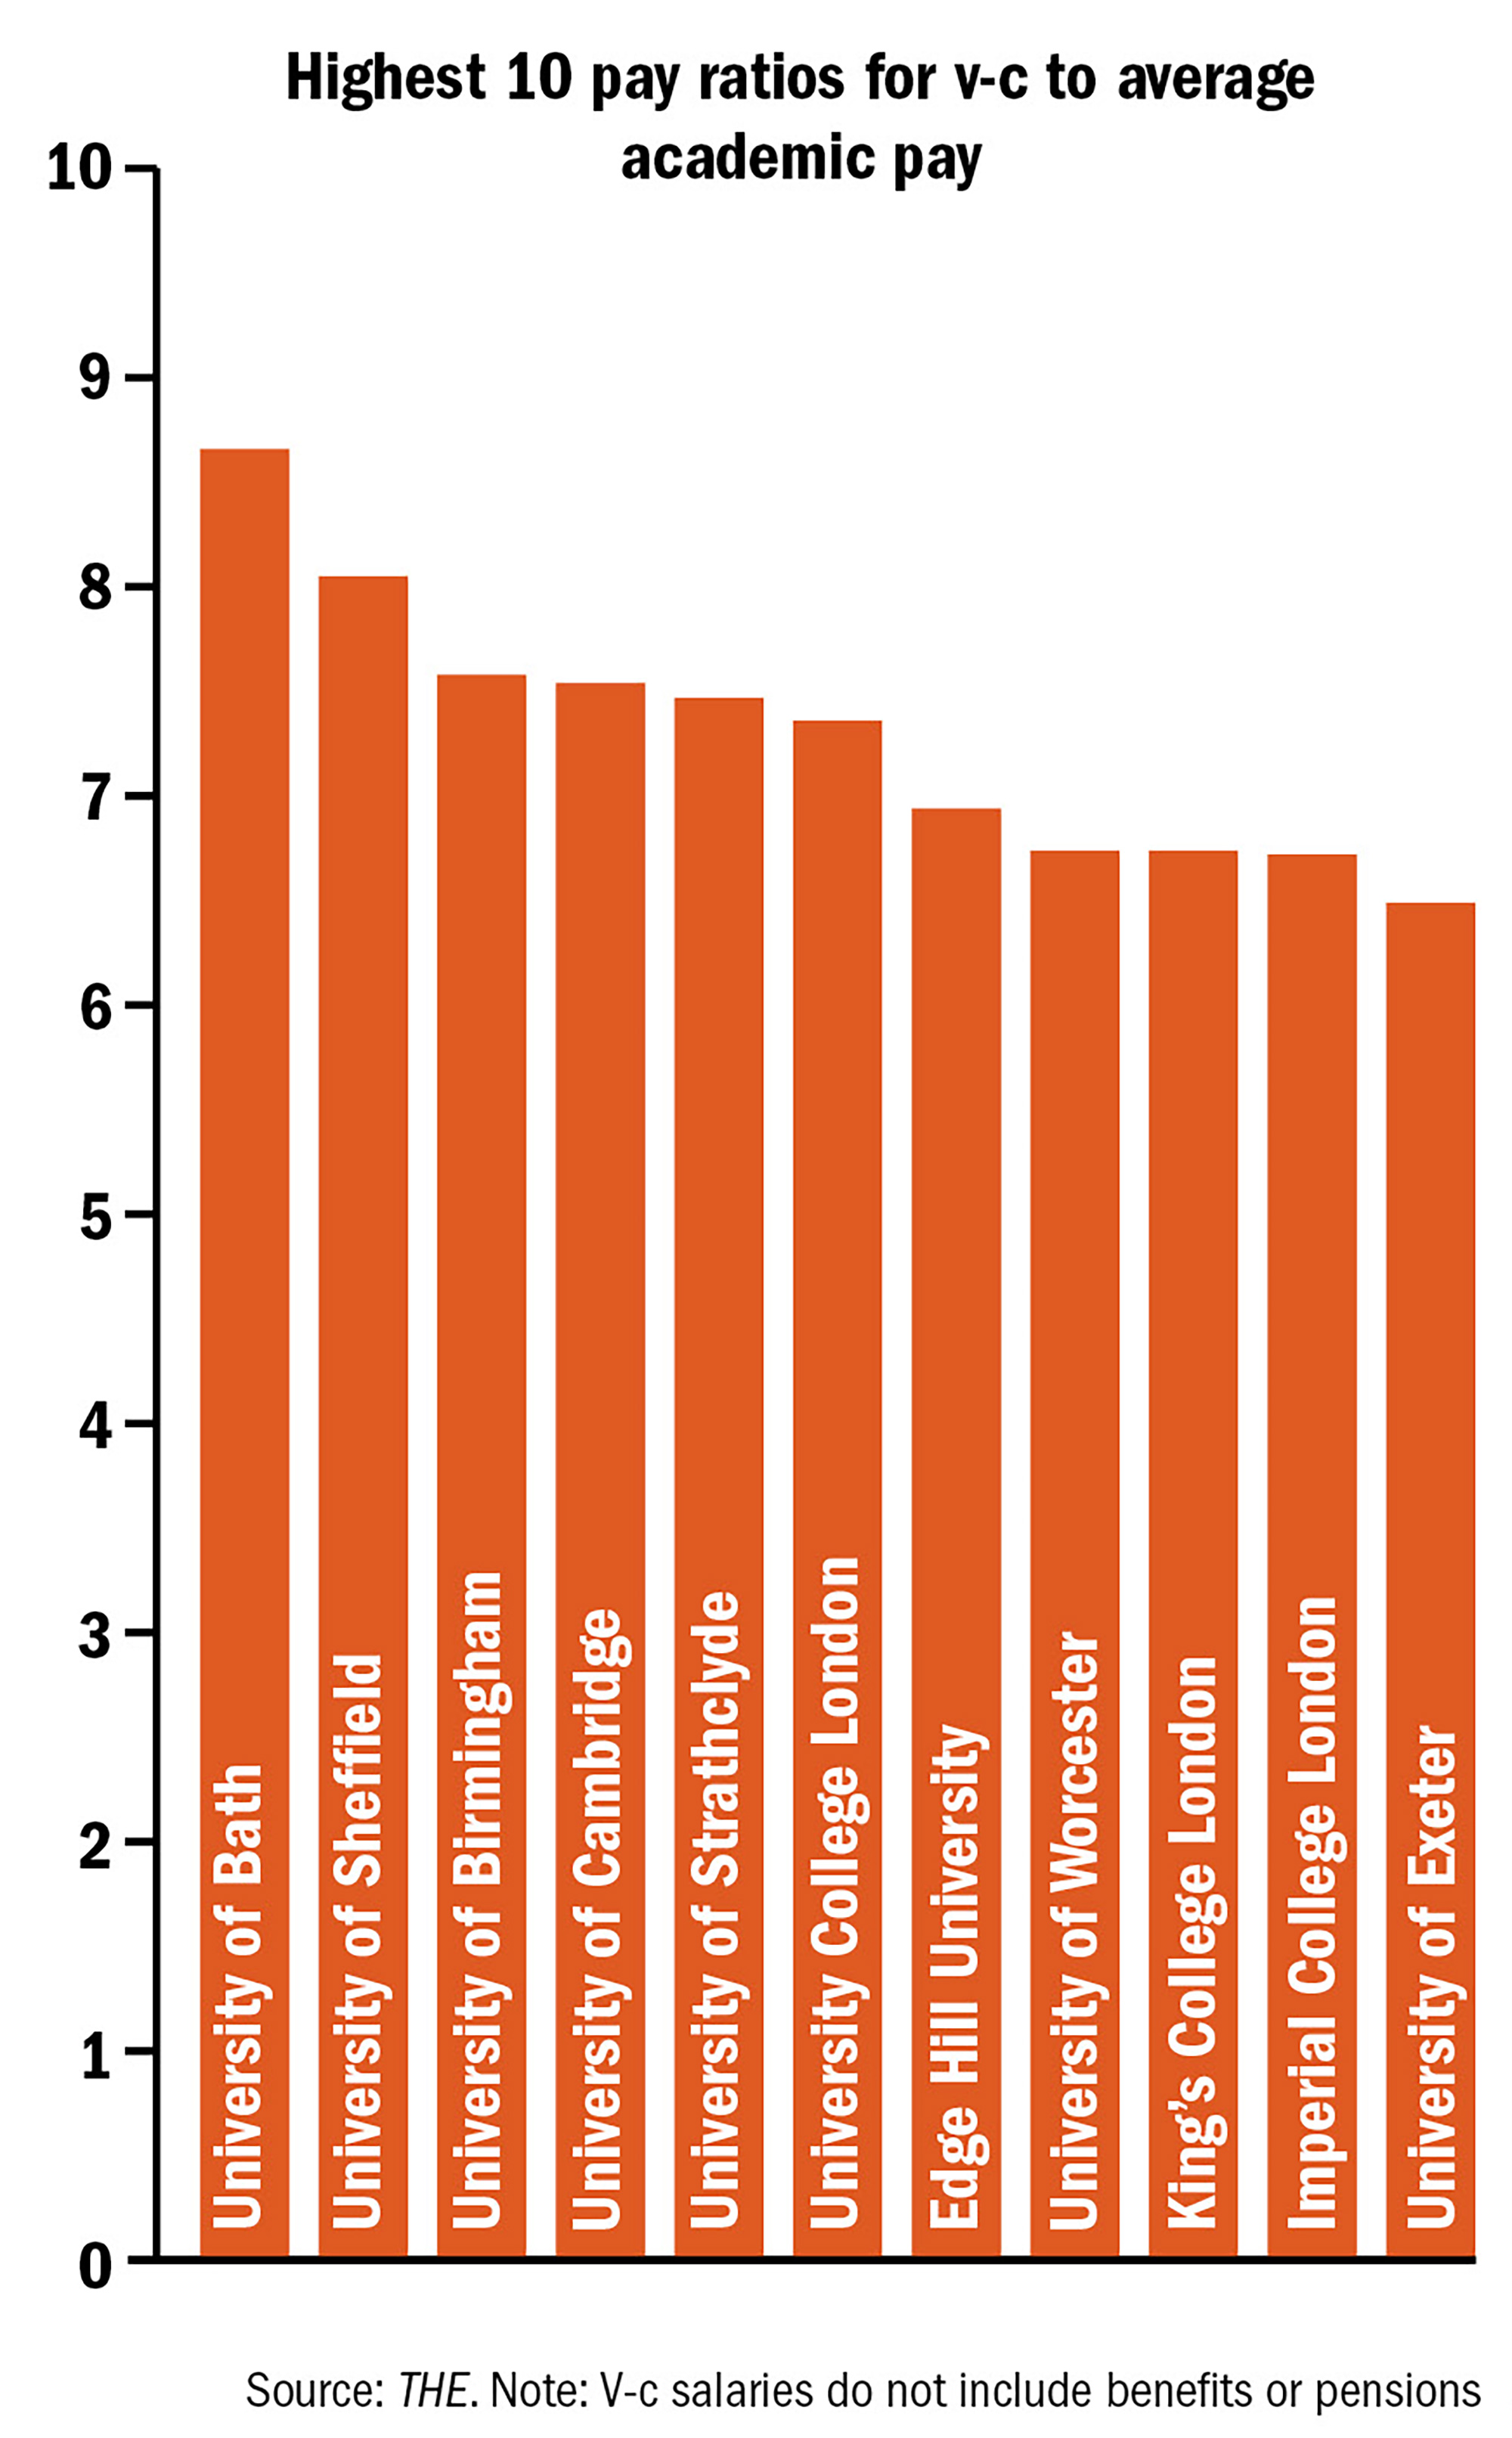
Source: THE.
Note: V-c salaries do not include benefits or pensions
The fact that most universities tend to cluster together in terms of their leaders’ remuneration levels while others seem to offer considerably bigger rises and overall packages, more out of line with average academic pay, highlights that there is an issue that needs tackling, according to Sally Hunt, general secretary of the University and College Union.
“The huge disparities, with the double-digit rises for some at the top and the more modest increases elsewhere, expose the arbitrary nature of pay in our universities,” she says. “We need much greater transparency of senior pay to ensure that vice-chancellors aren’t able to simply line their own pockets while holding down the wages of their staff.”
A Ucea spokesman says that it has tracked pay ratios since the Hutton review, “and we know that many higher education sector remuneration committees will consider these ratios when making decisions relating to senior pay”. He also points out that any comparisons of vice-chancellors’ pay increases with those for other staff “require an accurate assessment of the progression and merit pay increases that sit on top of the baseline increase for non-senior staff”.
Perhaps it is problematic to compare average academic pay with that of vice-chancellors, who as William Locke, director of the Centre for Higher Education Studies at the UCL Institute of Education, points out, are recruited in “a distinctive labour market” that “doesn’t operate under the same rules as [those that apply to] other – even senior – academics”. However, if a vice-chancellor is tackling “much more important” issues such as the pay and conditions of early career academics, or those on teaching-only, research-only or other part-time and fixed-term contracts, then he or she “deserves to be well remunerated”, Locke believes.
The focus on pay comparisons at the top can also be “part of the problem”, Locke warns, as it can “escalate the reputational stakes among universities and encourage remuneration committees to pay more in order to signal the status and prestige of their institutions”.
Distribution of v-c to average academic salary pay ratios
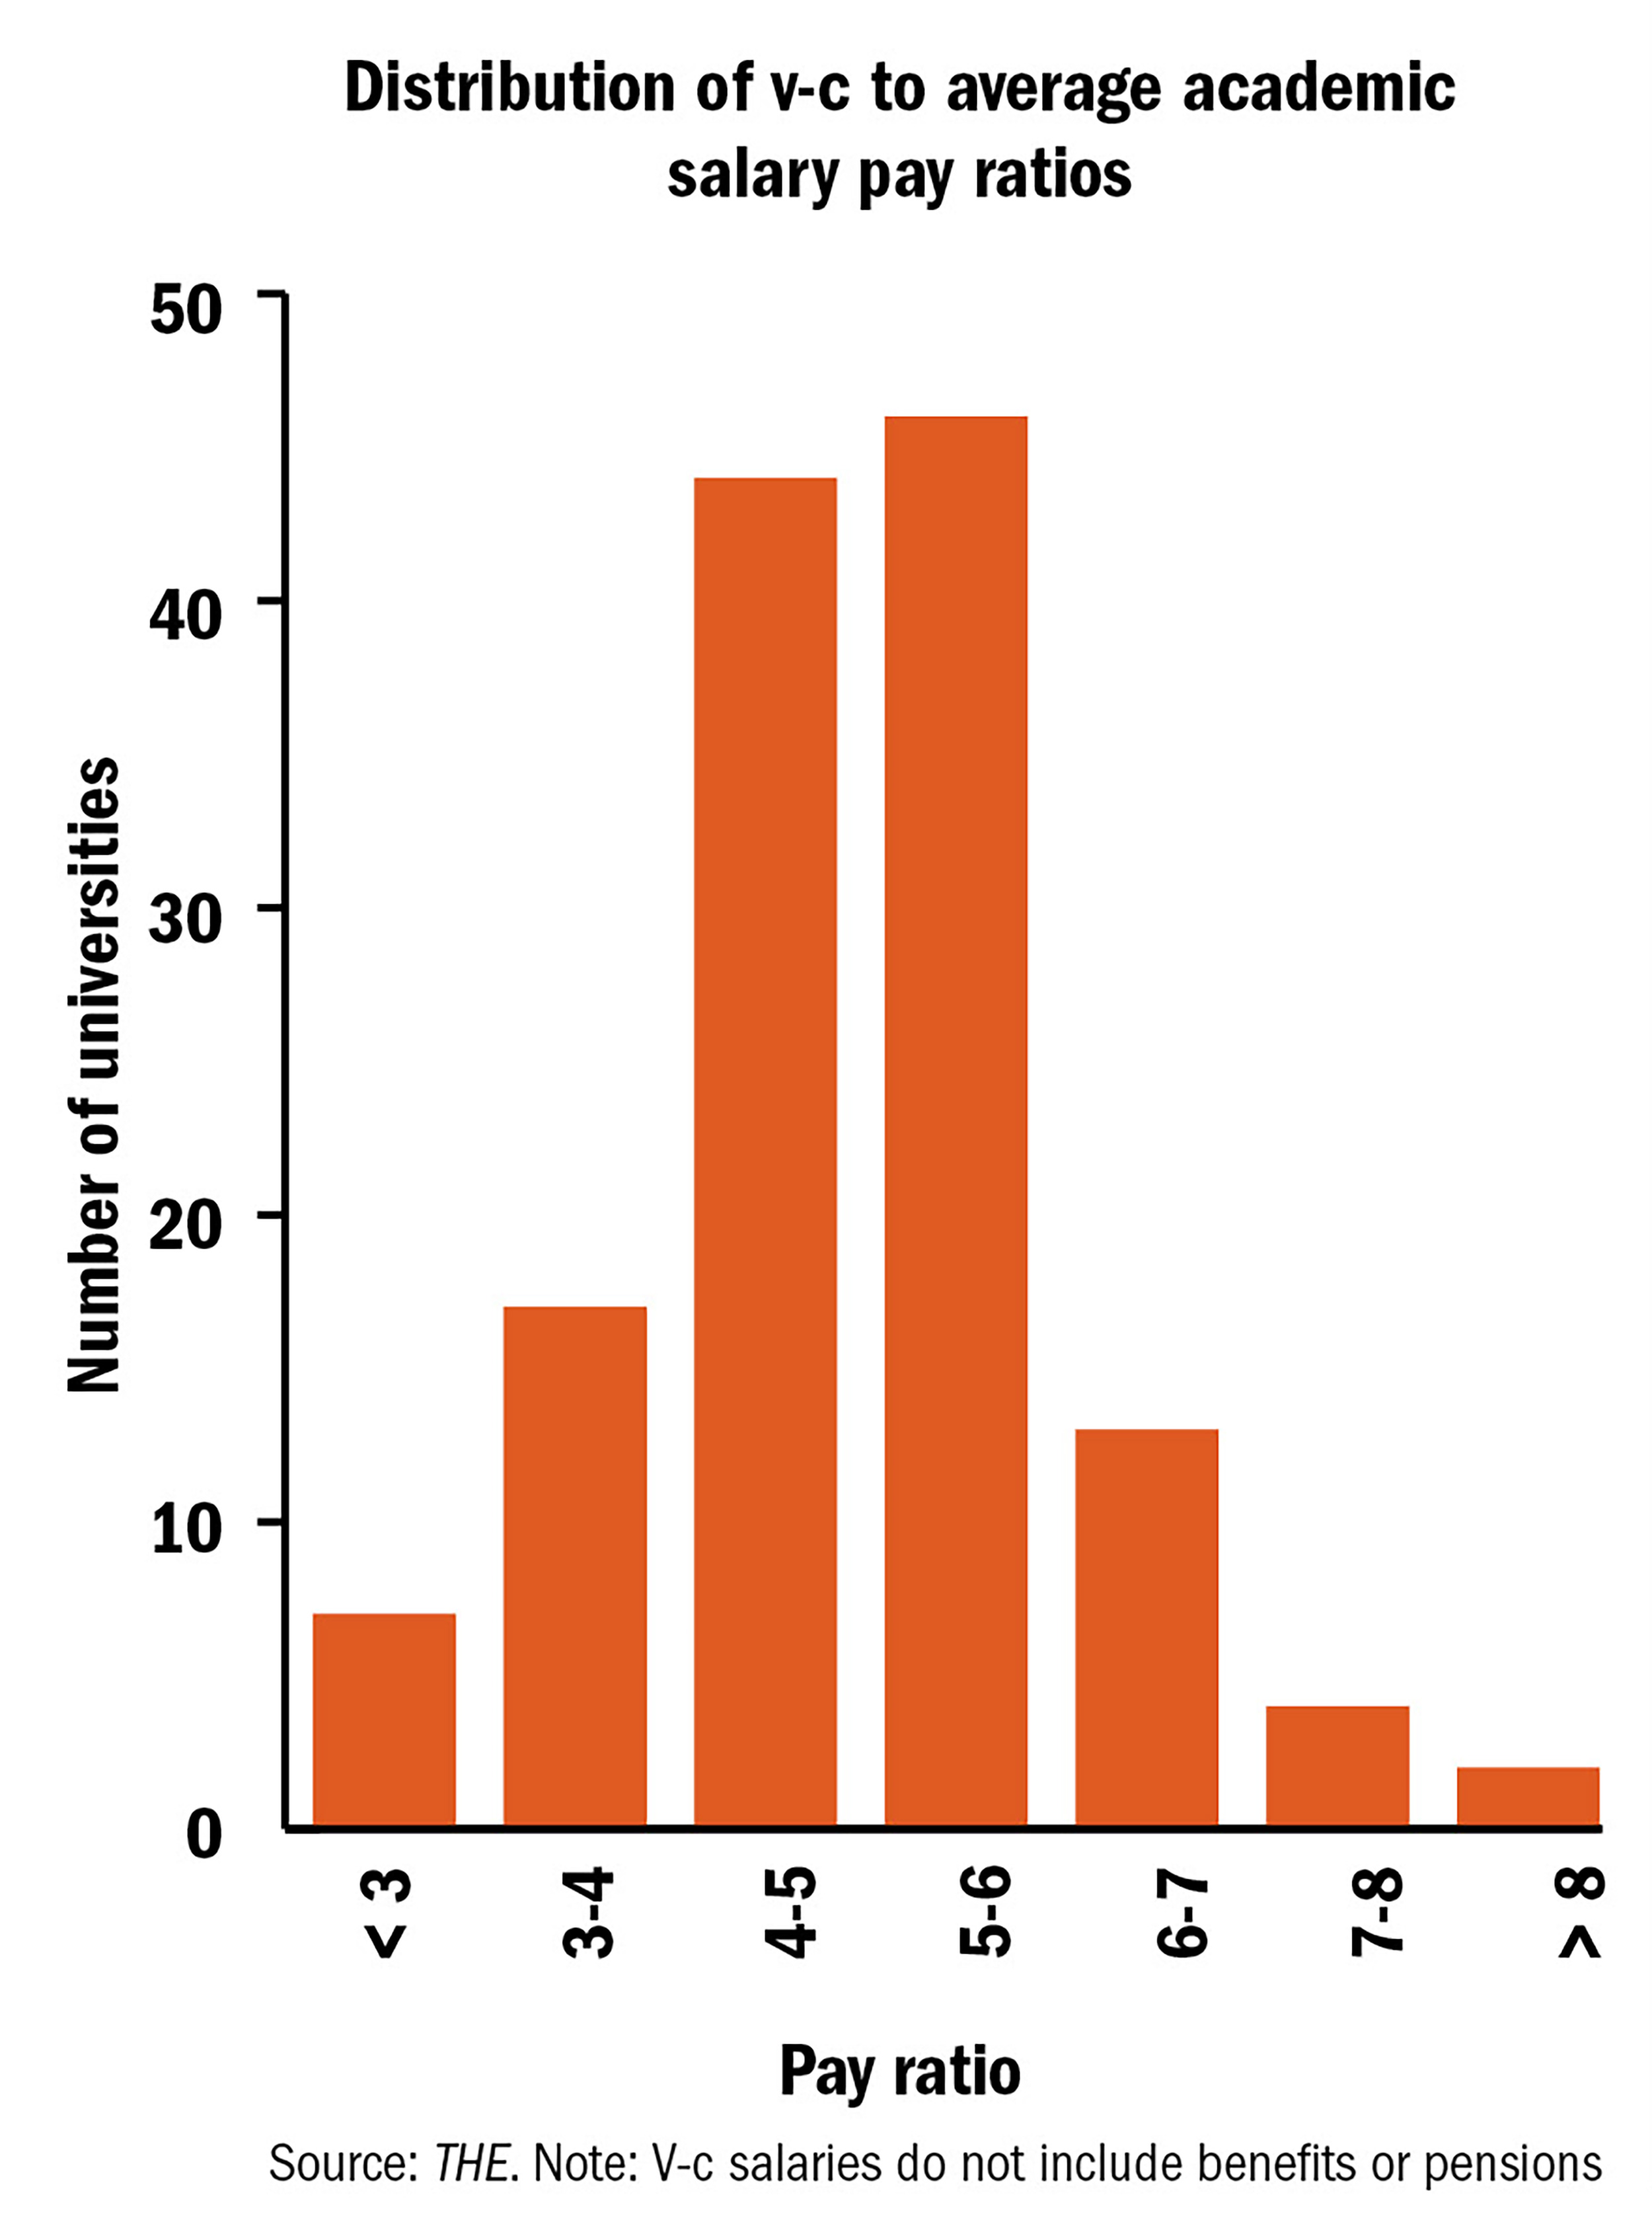
Source: THE.
Note: V-c salaries do not include benefits or pensions
The numbers don’t lie: exploring the v-c gender pay gap
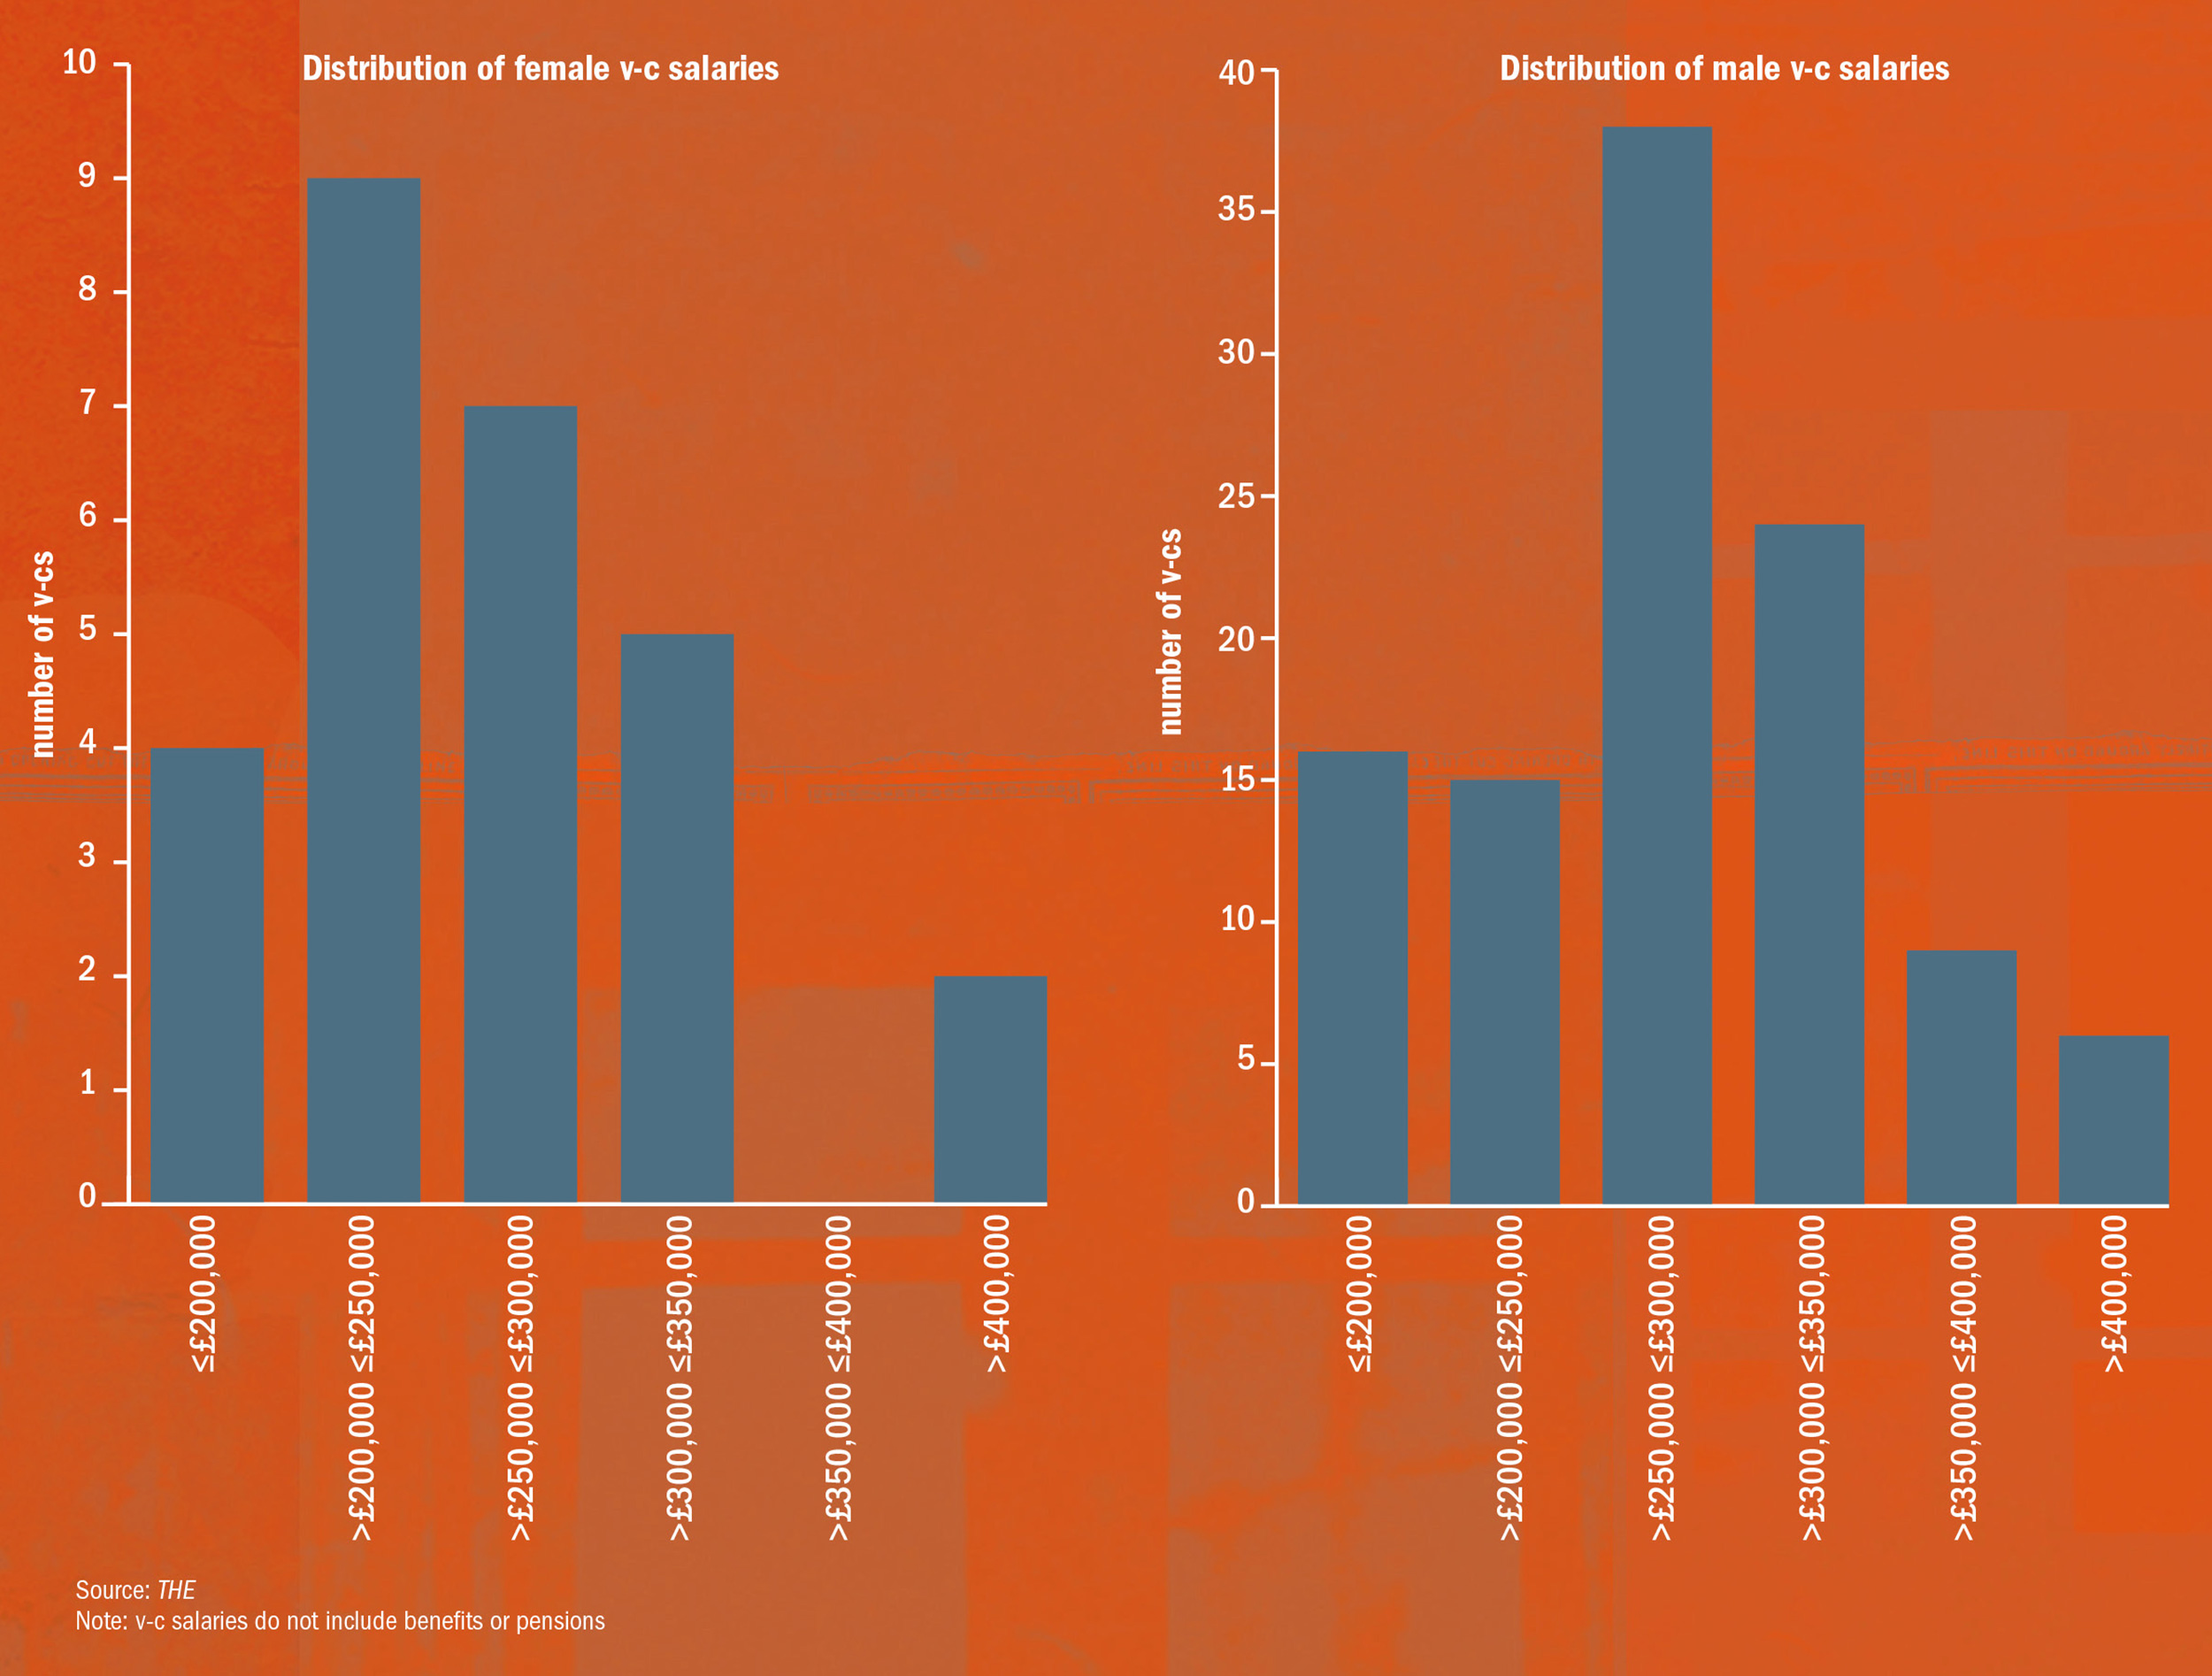
Source: THE
Note: v-c salaries do not include benefits or pensions
The past few years have seemingly seen a notable increase in the number of women being appointed to the top job in universities after the sector received stern criticism from many quarters for its lack of balance. But how many female vice-chancellors are there now, and how do their salaries compare with those of their male peers?
Discounting those universities where the top job changed hands during 2015‑16 (whose pay bills were typically higher as a consequence) shows that out of 135 institutions, 27 were led by women. This 20 per cent figure is an improvement on the 14 per cent proportion in 2012-13 .
However, looking at remuneration for male and female vice-chancellors suggests that there is a gender pay gap to close. The median pay package for male vice-chancellors in 2015-16 was £278,975, while for women it was £264,000, a gap of 5.4 per cent (not dissimilar to the 5.8 per cent gender pay gap for professors in the sector that year, based on mean pay).
It may be that the gap will close now that the appointment of female vice-chancellors is on the rise: as with professors, some new to the position may have started at a relatively low pay base. The averages may also be skewed by the types of institutions involved in the analysis. The figures do not include some of the more recent appointments of women to lead Russell Group universities, such as Louise Richardson at the University of Oxford (who took over at the beginning of 2016) and, more recently, Shearer West, who will take the helm at the University of Nottingham later this year.
Either way, at least more women are being appointed to the top job – in many cases reflecting more diversity on governing bodies.
According to John Rushforth, executive secretary of the Committee of University Chairs, governing councils now “absolutely realise that diversity of leadership teams is an important contributor to the success of an institution because diverse leadership is better leadership”.
Meanwhile, Grant Thornton’s Richard Shaw is “delighted” that there has been a “significant improvement on five or six years ago” in terms of female representation, and he is confident that the gender pay differential will even out over time.
“It may be that if you’re a female vice-chancellor it is your first post, so you might expect salaries to be slightly lower compared with men who are in their third or fourth leadership role,” he says. “But I am not aware that female and male vice-chancellors are treated any differently when it comes to pay.”
Simon Baker
Register to continue
Why register?
- Registration is free and only takes a moment
- Once registered, you can read 3 articles a month
- Sign up for our newsletter
Subscribe
Or subscribe for unlimited access to:
- Unlimited access to news, views, insights & reviews
- Digital editions
- Digital access to THE’s university and college rankings analysis
Already registered or a current subscriber?