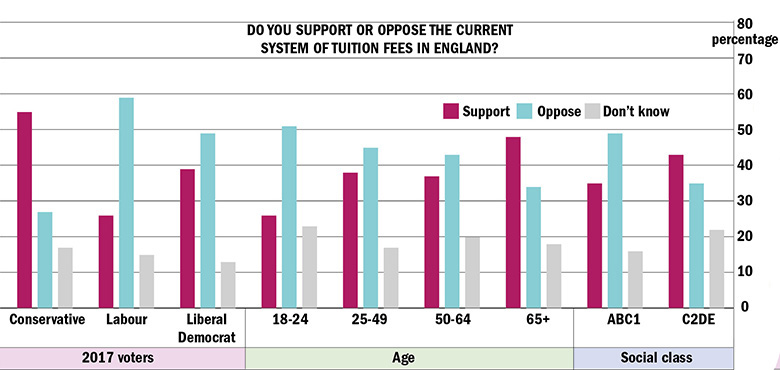
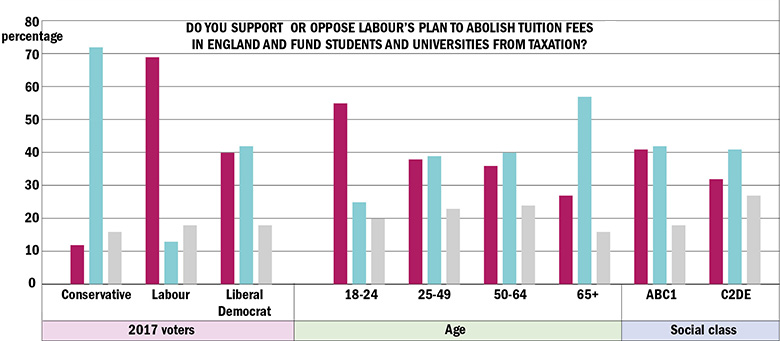
There is deep unhappiness with England’s current system of tuition fees among the young people most likely to be facing repayments under the status quo, with a generational gulf evident in attitudes to university financing, YouGov’s poll for Times Higher Education shows.
The question for the government is whether, if the status quo is maintained, this unhappiness with tuition fees will continue as young people age and keep making their repayments, start afresh with new generations of students, and eventually create irresistible opposition.
The subject of tuition fees was ranked by English participants 14th out of 17 in the list of priority issues when it comes to deciding how to vote in an election, chosen by just 6 per cent. Only transport, airport expansion and animal rights figured lower in the list of priorities.
– Lord Adonis is dead wrong: tuition fees should stay
– A graduate tax would bring transparency to university funding
But respondents in the 18-to-24 age group assigned higher importance to tuition fees, with 17 per cent of them putting it among their priority issues. For them, tuition fees was eighth highest on the list of important issues, above issues such as tax, welfare benefits and crime.
Just 26 per cent of those aged 18 to 24 supported the current system, against 48 per cent in the 65 and over category. Labour’s plan to abolish fees received backing from 55 per cent of those aged 18 to 24 and just 27 per cent of those aged 65 and over.
When it comes to Labour’s policy, viewpoints are polarised between Conservative and Labour voters to a greater extent than they are over the £9,000 system. Just 12 per cent of 2017 Tory voters offered support for Labour’s policy and 72 per cent opposed it. But 2017 Labour voters were enthusiastic in their backing, with 69 per cent in support and 13 per cent opposing.
Are fees in favour? Majority of young people dislike status quo
Who backs free tuition plans? The young and the middle class
Labour has already shown how it can extract political leverage from the issue in a substantial number of seats with higher proportions of young people and students.
“Overall the THE poll findings suggest that tuition fees are not a major issue for the vast majority of people when thinking about who to vote for,” said Stephen Fisher, associate professor in political sociology at the University of Oxford.
But he added that “despite more than 90 per cent of people failing to list tuition fees as the top three or four issues when deciding how to vote, attitudes to policy on fees is very strongly linked to vote choice”, with clear divergences between Tory and Labour supporters.
“This may mean that tuition fee policy matters more to Labour than the issue generally appears to matter to voters,” Dr Fisher said.
He added: “It also remains true that students tend to vote disproportionately for the party that offers the most generous funding arrangements, and this can have noticeable effects on constituency outcomes where there are large student populations.
“In last month’s general election this was most famously seen in Canterbury, which Labour won for the first time, apparently thanks to substantially higher turnout from Labour-supporting students.”
Tim Bale, professor of politics at Queen Mary University of London and author of The Conservative Party from Thatcher to Cameron, said: “Given that the Tories already seem to have a problem attracting the support of young people, and given the fact that many of them may retain some residual loyalty to Labour as they get older, doing nothing about a policy that attracts a fair degree of hostility may be unwise.”
There was also a clear class divide on the current system. While 49 per cent of those in the ABC1 category (equating to middle class) opposed it, that was true of only 35 per cent of those in the C2DE category (equating to working class). A class split was also evident in support for Labour’s policy, with 41 per cent of ABC1s and 32 per cent of CD2Es backing the plan.
“Predictably enough, middle-class people seem keener on change than working-class people, who still don’t go to university in anywhere near as great a number,” said Professor Bale.
Issues that matter most: voting priorities by age group
|
Percentage choosing issue as three or four ‘most important issues to you when you decide how to vote in a general election’ |
|||||
|
|
Total |
Age 18-24 |
Age 25-49 |
Age 50-64 |
Age |
|
Britain leaving the EU |
51 |
39 |
46 |
49 |
68 |
|
Health |
49 |
48 |
46 |
51 |
53 |
|
The economy |
39 |
33 |
39 |
39 |
42 |
|
Immigration and asylum |
38 |
20 |
32 |
39 |
58 |
|
Education |
24 |
35 |
28 |
18 |
14 |
|
Housing |
19 |
27 |
21 |
15 |
14 |
|
Pensions |
18 |
3 |
9 |
26 |
35 |
|
Crime |
17 |
8 |
17 |
19 |
19 |
|
Welfare benefits |
17 |
14 |
19 |
16 |
18 |
|
Tax |
16 |
15 |
18 |
16 |
10 |
|
The environment |
12 |
25 |
11 |
13 |
8 |
|
Family life and childcare |
10 |
11 |
16 |
5 |
4 |
|
Infrastructure |
7 |
9 |
6 |
6 |
5 |
|
Tuition fees |
6 |
17 |
5 |
5 |
2 |
|
Animal rights |
5 |
7 |
5 |
8 |
2 |
|
Transport |
4 |
4 |
4 |
2 |
3 |
|
Airport expansion |
1 |
0 |
1 |
0 |
0 |
|
None of these |
2 |
2 |
3 |
3 |
1 |
|
Don't know |
4 |
6 |
5 |
5 |
0 |
Source: THE/YouGov poll of 1,607 adults. All figures, unless otherwise stated, are from YouGov plc. Fieldwork was undertaken between 12 and 13 July 2017. The survey was carried out online. The figures have been weighted and are representative of all Great Britain adults (aged 18+), although England-only figures are cited throughout.
Michael Gove, the environment secretary and former education secretary, recently suggested that “it’s wrong if people who don’t go to university find that they have to pay more in taxation to support those who do”. Putting aside the fact that there is a public subsidy under the current system in writing off outstanding student loan balances, perhaps that view has fed through to those who are less likely to go to university.
On the gap between the generations on fees, Nick Hillman, director of the Higher Education Policy Institute, said that the trebling of fees in 2012 obviously “helps to explain why it is currently the youngest voters who are most opposed to the system. Those under 24 typically have loans that are much bigger than their older siblings.”
He added: “It is plausible that we have yet to see the biggest impact of fees and loans on elections. Because it is the repayment phase that matters most, the more workers there are with post-2012 loans, the bigger their electoral impact could be. But we also shouldn’t forget that, however higher education is paid for, it is people of working age who will pay for it one way or the other.”
The status quo and Labour’s no-fees system are, currently, the only options on the table. But Hepi’s 2017 Student Academic Experience Survey gauged the views of students on the right balance of funding between public and private sources.
Asked who should contribute to the cost of teaching undergraduates, 22 per cent of English students chose the option “the government should pay all”, 43 per cent said “the government should pay more”, 18 per cent said “students and the government should each pay half”, 10 per cent said “students should pay more”, and just 3 per cent said “students should pay all”.
Perhaps the opposition, on balance, to both the £9,250 status quo and Labour’s proposed solution shown in the THE poll suggests that “national debate” on tuition fees and university funding – accidentally sparked by first secretary Damian Green – is very much needed after all.
All figures, unless otherwise stated, are from YouGov plc. Total sample size was 1,607 adults. Fieldwork was undertaken between 12 and 13 July 2017. The survey was carried out online. The figures have been weighted and are representative of all Great Britain adults (aged 18+).
Register to continue
Why register?
- Registration is free and only takes a moment
- Once registered, you can read 3 articles a month
- Sign up for our newsletter
Subscribe
Or subscribe for unlimited access to:
- Unlimited access to news, views, insights & reviews
- Digital editions
- Digital access to THE’s university and college rankings analysis
Already registered or a current subscriber?