
Browse the full Times Higher Education World Reputation Rankings 2017 results
The Times Higher Education World Reputation Rankings are created using the world’s largest invitation-only academic opinion survey – a unique piece of research.
The Academic Reputation Survey, available in 15 languages, uses United Nations data as a guide to ensure that the response coverage is as representative of world scholarship as possible. It is also evenly spread across academic disciplines.
The questionnaire, which is administered on behalf of THE by Elsevier, targets only experienced, published scholars, who offer their views on excellence in research and teaching within their disciplines and at institutions with which they are familiar.
The 2017 rankings are based on a survey carried out between January 2017 and March 2017, which received a total of 10,566 responses from 137 countries.
Field work
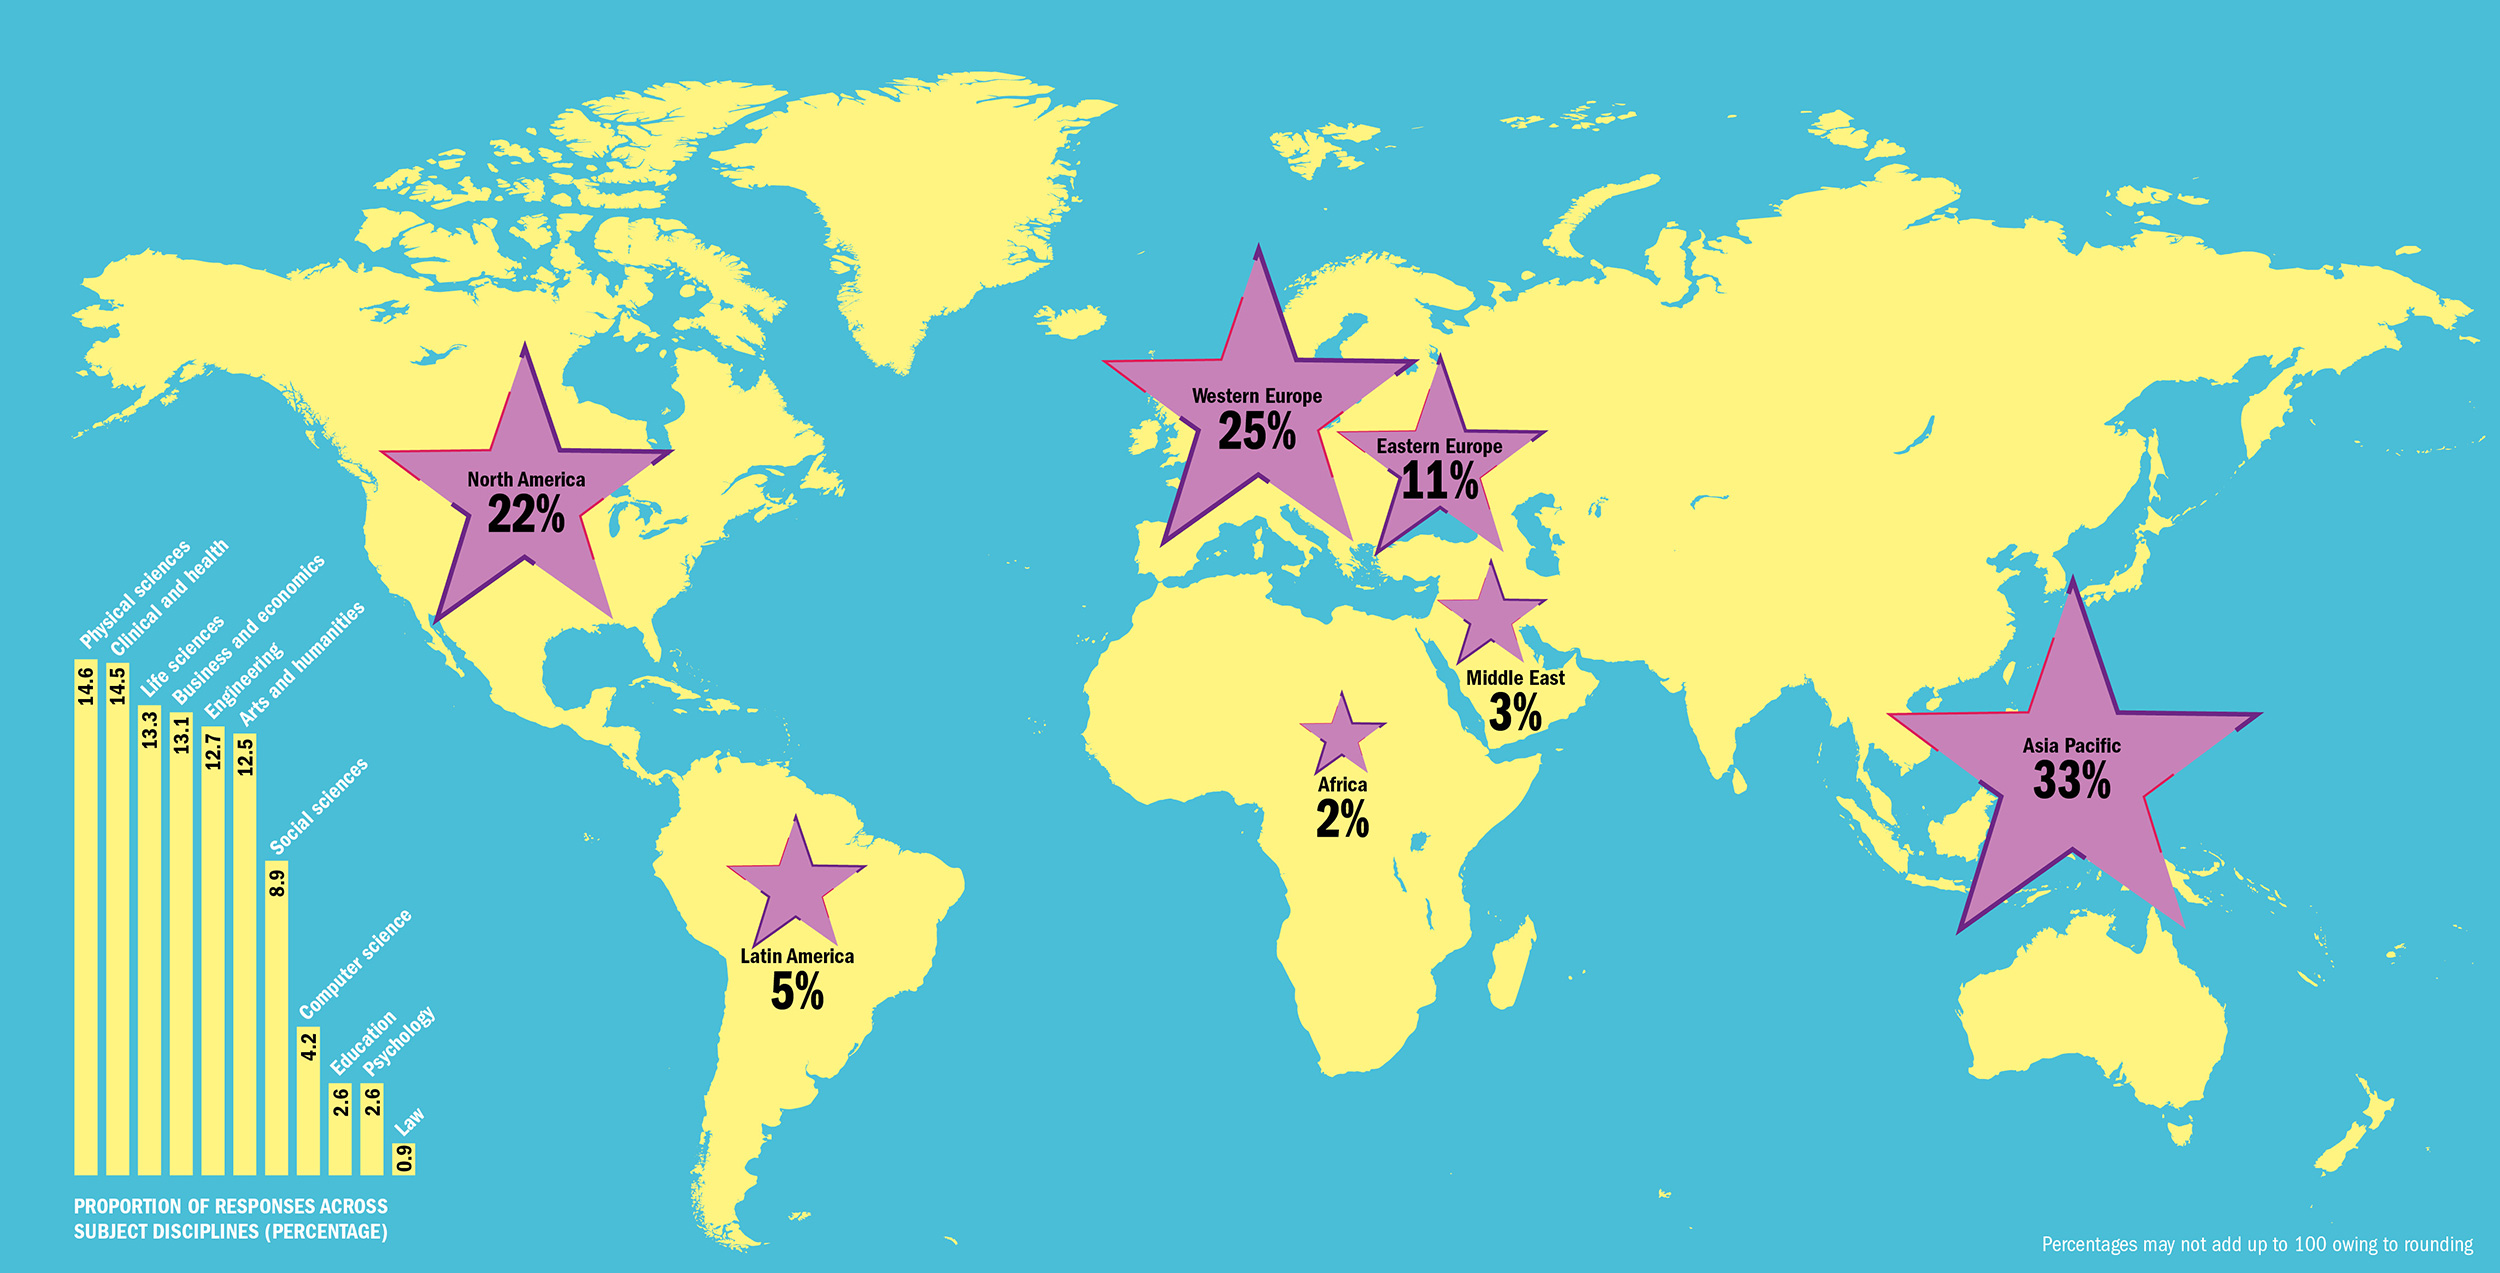
We have worked hard to ensure a balanced spread of responses across the disciplines. The best represented subject was physical sciences (accounting for 14.6 per cent of responses), followed closely by clinical and health (14.5 per cent). Also well represented were life sciences (13.3 per cent of responses), business and economics (13.1 per cent), engineering (12.7 per cent) and arts and humanities (12.5 per cent). The rest of the responses came from social sciences (8.9 per cent), computer science (4.2 per cent), education (2.6 per cent), psychology (2.6 per cent) and law (0.9 per cent).
We have also maintained a fair distribution of survey responses across the regions. A total of 22 per cent of responses hail from North America. The rest of the responses break down as follows: 33 per cent from the Asia Pacific region, 25 per cent from Western Europe, 11 per cent from Eastern Europe, 5 per cent from Latin America, 3 per cent from the Middle East and 2 per cent from Africa.
Where countries were over- or under-represented, THE ’s data team weighted the responses to more closely reflect the actual geographical distribution of scholars, based on UN data.
In the survey, scholars are questioned at the level of their specific subject discipline. They are not asked to create a ranking themselves or to list a large range of institutions, but to name no more than 15 universities that they believe are the best in each category (research and teaching), based on their own experience.
The survey data will be used alongside 11 objective indicators to help create the THE World University Rankings 2017-18, which will be unveiled in September 2017.
The reputation table ranks institutions according to an overall measure of their esteem that combines data on their reputation for research and teaching.
The two scores are combined at a ratio of 2:1, giving more weight to research because our expert advisers have suggested that there is greater confidence in respondents’ ability to make accurate judgements about research quality.
The scores are based on the number of times that an institution is cited by respondents as being the best in their field. The number one institution, Harvard University, was the one selected most often. The scores for all other institutions in the table are expressed as a percentage of Harvard’s, which is set at 100.
For example, the University of Oxford received 69.1 per cent of the number of nominations that Harvard gained, giving it a score of 69.1 against Harvard’s 100. This scoring system, which differs from that used in the THE World University Rankings, is intended to give a clearer and more meaningful perspective on the reputation data in isolation.
The top 100 universities by reputation are listed, but THE has decided to rank only the top 50 because the differentials between institutions after that point become narrow. The institutions that make up the second half of the table are listed in groups of 10, in alphabetical order, although the number in each group may vary owing to some institutions at the thresholds having the same scores.
POSTSCRIPT:
Print headline: The numbers behind the names
Register to continue
Why register?
- Registration is free and only takes a moment
- Once registered, you can read 3 articles a month
- Sign up for our newsletter
Subscribe
Or subscribe for unlimited access to:
- Unlimited access to news, views, insights & reviews
- Digital editions
- Digital access to THE’s university and college rankings analysis
Already registered or a current subscriber?