World University Rankings 2019: methodology

We are careful and consistent in our approach to collecting and evaluating data for the World University Rankings. Here we explain how we handle the data to position more than 1,200 institutions worldwide

September 7, 2018
WUR 2019 cover

Browse the full results of the World University Rankings 2019


The Times Higher Education World University Rankings are the only global performance tables that judge research-intensive universities across all their core missions: teaching, research, knowledge transfer and international outlook. We use 13 carefully calibrated performance indicators to provide the most comprehensive and balanced comparisons, trusted by students, academics, university leaders, industry and governments.

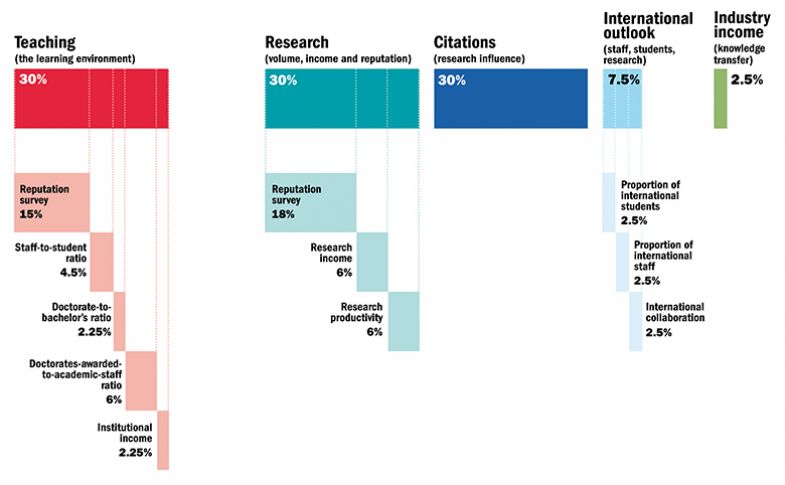
The performance indicators are grouped into five areas: teaching (the learning environment); research (volume, income and reputation); citations (research influence); international outlook (staff, students and research); and industry income (knowledge transfer).


Short on time? Here’s a video explaining our rankings methodology in less than two minutes.


Exclusions

Universities can be excluded from the World University Rankings if they do not teach undergraduates, or if their research output amounted to fewer than 1,000 relevant publications between 2013 and 2017 (with a minimum of 150 a year). Universities can also be excluded if 80 per cent or more of their research output is exclusively in one of our 11 subject areas.

Data collection

Institutions provide and sign off their institutional data for use in the rankings. On the rare occasions when a particular data point is not provided, we enter a conservative estimate for the affected metric. By doing this, we avoid penalising an institution too harshly with a “zero” value for data that it overlooks or does not provide, but we do not reward it for withholding them.

Getting to the final result

Moving from a series of specific data points to indicators, and finally to a total score for an institution, requires us to match values that represent fundamentally different data. To do this, we use a standardisation approach for each indicator, and then combine the indicators in the proportions indicated to the right.

The standardisation approach we use is based on the distribution of data within a particular indicator, where we calculate a cumulative probability function, and evaluate where a particular institution’s indicator sits within that function.

For all indicators except for the Academic Reputation Survey, we calculate the cumulative probability function using a version of Z-scoring. The distribution of the data in the Academic Reputation Survey requires us to add an exponential component.

World University Rankings 2019 methodology

Metrics

Teaching (the learning environment) – 30%

  • Reputation survey: 15%
  • Staff-to-student ratio: 4.5%
  • Doctorate-to-bachelor’s ratio: 2.25%
  • Doctorates-awarded-to-academic-staff ratio: 6%
  • Institutional income: 2.25%

The most recent Academic Reputation Survey (run annually) that underpins this category was carried out between January and March 2018. It examined the perceived prestige of institutions in teaching. We have worked hard to ensure a balanced spread of responses across disciplines and countries. Where disciplines or countries were over- or under-represented, THE’s data team weighted the responses to more closely reflect the actual distribution of scholars (more details here). The 2018 data are combined with the results of the 2017 survey, giving more than 20,000 responses.

As well as giving a sense of how committed an institution is to nurturing the next generation of academics, a high proportion of postgraduate research students also suggests the provision of teaching at the highest level that is thus attractive to graduates and effective at developing them. This indicator is normalised to take account of a university’s unique subject mix, reflecting that the volume of doctoral awards varies by discipline.

Institutional income is scaled against academic staff numbers and normalised for purchasing-power parity (PPP). It indicates an institution’s general status and gives a broad sense of the infrastructure and facilities available to students and staff.

Research (volume, income and reputation) – 30%

  • Reputation survey: 18%
  • Research income: 6%
  • Research productivity: 6%

The most prominent indicator in this category looks at a university’s reputation for research excellence among its peers, based on the responses to our annual Academic Reputation Survey (see above).

Research income is scaled against academic staff numbers and adjusted for purchasing-power parity (PPP). This is a controversial indicator because it can be influenced by national policy and economic circumstances. But income is crucial to the development of world-class research, and because much of it is subject to competition and judged by peer review, our experts suggested that it was a valid measure. This indicator is fully normalised to take account of each university’s distinct subject profile, reflecting the fact that research grants in science subjects are often bigger than those awarded for the highest-quality social science, arts and humanities research.

To measure productivity we count the number of publications published in the academic journals indexed by Elsevier’s Scopus database per scholar, scaled for institutional size and normalised for subject. This gives a sense of the university’s ability to get papers published in quality peer-reviewed journals. Last year, we devised a method to give credit for papers that are published in subjects where a university declares no staff.

Citations (research influence) – 30%

Our research influence indicator looks at universities’ role in spreading new knowledge and ideas.

We examine research influence by capturing the average number of times a university’s published work is cited by scholars globally. This year, our bibliometric data supplier Elsevier examined 67.9 million citations to 14.1 million journal articles, article reviews, conference proceedings, books and book chapters published over five years. The data include more than 25,000 academic journals indexed by Elsevier’s Scopus database and all indexed publications between 2013 and 2017. Citations to these publications made in the six years from 2013 to 2018 are also collected.

The citations help to show us how much each university is contributing to the sum of human knowledge: they tell us whose research has stood out, has been picked up and built on by other scholars and, most importantly, has been shared around the global scholarly community to expand the boundaries of our understanding, irrespective of discipline.

The data are normalised to reflect variations in citation volume between different subject areas. This means that institutions with high levels of research activity in subjects with traditionally high citation counts do not gain an unfair advantage.

We have blended equal measures of a country-adjusted and non-country-adjusted raw measure of citations scores.

In 2015-16, we excluded papers with more than 1,000 authors because they were having a disproportionate impact on the citation scores of a small number of universities. In 2016-17, we designed a method for reincorporating these papers. Working with Elsevier, we developed a fractional counting approach that ensures that all universities where academics are authors of these papers will receive at least 5 per cent of the value of the paper, and where those that provide the most contributors to the paper receive a proportionately larger contribution.

International outlook (staff, students, research) – 7.5%

  • Proportion of international students: 2.5%
  • Proportion of international staff: 2.5%
  • International collaboration: 2.5%

The ability of a university to attract undergraduates, postgraduates and faculty from all over the planet is key to its success on the world stage.

In the third international indicator, we calculate the proportion of a university’s total research journal publications that have at least one international co-author and reward higher volumes. This indicator is normalised to account for a university’s subject mix and uses the same five-year window as the “Citations: research influence” category.

Industry income (knowledge transfer) – 2.5%

A university’s ability to help industry with innovations, inventions and consultancy has become a core mission of the contemporary global academy. This category seeks to capture such knowledge-transfer activity by looking at how much research income an institution earns from industry (adjusted for PPP), scaled against the number of academic staff it employs.

The category suggests the extent to which businesses are willing to pay for research and a university’s ability to attract funding in the commercial marketplace – useful indicators of institutional quality.


The calculation of the Times Higher Education World University Rankings 2019 has been independently audited by professional services firm PricewaterhouseCoopers (PwC), making these the only global university rankings to be subjected to full, independent scrutiny of this nature.

Read more about the PwC/Times Higher Education World University Rankings 2019 report.

Register to continue

Why register?

  • Registration is free and only takes a moment
  • Once registered, you can read 3 articles a month
  • Sign up for our newsletter
Register
Please Login or Register to read this article.

Reader's comments (29)

Good Morning! I am Dr. Babak Mahmood, Director Quality Enhancement Cell, Government College University, Faisalabad. I want to know the way to apply for World Ranking. Please guide me in this. Regards,
It seems like these breakdowns indicate 33% of a university's score come from the Academic Reputation Survey (15% in the "Teaching" indicator, which makes up 50% of that indicator, plus 18% in the "Research" indicator, which constitutes 60% of that indicator). According to your website's description "...scholars are questioned at the level of their specific subject discipline. They are not asked to create a ranking themselves or to list a large range of institutions, but to name no more than 15 universities that they believe are the best in each category (research and teaching), based on their own experience." (https://www.timeshighereducation.com/world-university-rankings/academic-reputation-survey-explained, 2016) So 33% of a university's score comes from how researchers/professors feel about institutions, but 0% comes from how students feel regarding their experience at the university they actually attended. Am I understanding this correctly?
Hello Dr Mahmood. We’re pleased to hear of your interest in taking part in our rankings. To do so, please email our Rankings team (profilerankings@timeshighereducation.com). They will explain the process. Best regards
May I have a copy of the report?
Hello! I am Dr Anastasia Logvinenko from Ushynsky University, Odessa, Ukraine. We would like to take part in your rankings. Please explain the way we can do it. Best regards.
Hello Dr Logvinenko. It’s great to hear that you are interested in taking part. To get started, send an email our Rankings team (profilerankings@timeshighereducation.com). They will explain the process and detail what information is required. Best regards
Where can I find the template for the world university ranking data collection? If possible send it to my email associated with this account. Thanks.
Dear THE World University Rankings Teams, I am Dr Sugiharto, from Diponegoro University, Semarang, Central Java, Indonesia. We would like to take part in your rankings. However, we don't know how to do. Could you please to explain the way we can do it. We have sent an email to profilerankings@timeshighereducation.com, but the email could not be sent. It seems that the email address is wrong. Thank you very much Best regards, Sugiharto
Hello. We can't see any problems with the email address profilerankings@timeshighereducation.com. Perhaps you could try again. If that does not work, try this email address: rankings@timeshighereducation.com
How do define academic staff: Is it only tenured or tenure-track faculty positions or any employee (researchers, adjunct teaching staff, et c)? And how do you obtain the numbers?
Hi there. Academic staff is defined as the full-time equivalent number of staff employed in an academic post, for example lecturer, reader or professor. For more information on the methodology, you can email rankings@timeshighereducation.com.
Good Morning! In relation to the Research productivity, the website says: "To measure productivity we count the number of publications published in the academic journals indexed by Elsevier’s Scopus database per scholar, scaled for institutional size and normalised for subject." Please, could you tell me what years are considered to count the papers? Thank you!
Hello, For the World University Rankings 2019 published in September 2018, we considered all relevant publications between 2013 and 2017. (Relevant publications are five types of publications: journal articles, article reviews, conference proceedings, books and book chapters). More information on the bibliometrics we used for the rankings can be found in the Citations (research influence) – 30% paragraph on https://www.timeshighereducation.com/world-university-rankings/methodology-world-university-rankings-2019.
Hello, Does PEKING UNION MEDICAL COLLEGE research production computed in TSINGHUA UNIVERSITY's scores? Thanks!
Hello, I have a follow-up question on Research Productivity. It counts the publications per scholar (what I understand is the total number of publications divided by the total number of academic and research staff). If 5-year publications are considered for analysis, what years are considered to count the staff ? As universities only submit a single year of staff number to THE (2016 data for 2019 rankings), I wonder how this works for calculating research productivity. Thank you.
Research productivity index is a hybrid indicator, using data directly submitted by the institution (portal data) and bibliometrics (provided by Elsevier). We use the last five years of data for the bibliometric data: 2013 to 2017 for the World University Rankings 2019. For the academic staff and research staff, which are supplied by the institution, we use the reference year from two years ago, which proves to be the most complete year across the world. We need to compare universities using data from the same year, and some universities have academic years that finish at different times of the calendar year. There is also a lag required for data to be collated, verified and approved, and this varies among institutions. Therefore, in global terms, the most complete data available for all institutions have been found to be from two years ago. We use the year 2016 for the World University Rankings 2019 consistently for all the data supplied by the institution: staff, students, degrees and income. We could indeed refine the data collection for academic staff and research staff in terms of time period and align this more clearly on the time period used for bibliometrics, therefore requesting the data for the past five years…but this would multiply the amount of data we request from institutions, which is already quite high. Furthermore, the more granular the data, the more difficult to collect it consistently across the world.
Where is a separate list of Universities in Africa, like you got one for other regions such as UK, Canada, Asia Pacific?
Hi, We have a list of the best universities in Africa 2019 here: https://www.timeshighereducation.com/student/best-universities/best-universities-africa. We also have a list of the best universities in the Arab World 2018, taking in parts of the Middle East and North Africa: https://www.timeshighereducation.com/student/best-universities/best-universities-arab-world. I hope that helps.
Could you tell me how the research evaluation methodology accounts for non-journal article publications; ie books, book chapters, conference papers? How are citations in books, book chapters and conference papers brought into account? If these are not counted, how does the method control for disciplines where the book, for example, is the most highly regarded output? Why is a comprehensive source of citation data such as Google Scholar not used?
Hi there, For a fuller explanation, you should email your query to our data team at profilerankings@timeshighereducation.com.
Thank you tsablan for your response to my question on research productivity. It helps me to better understand THE ranking methodology.
It is noticeable that a large factor in the ranking is the reputation score. This, however, is likely to be influenced by factors such as a venerable and long history and less by present performance. This is evidenced to some extent by the often significant differences between the research rating (dominated by reputation) and the citation impact. Especially younger institutions seem to score badly on the first and much more strongly on the second which suggests that reputation score lags the true quality of the research in time so much that it bcomes a distorting factor. It would be very interesting to see what the ranking would look like when the reputation score is stripped out.
Bonjour, je suis Meftah Abdeljalil, étudiant à l'Ecole Nationale Supérieure de l'Administration au Maroc et je travaille actuellement sur la thématique des classements internationaux des universités. Je veux avoir une idée sur le processus à suivre pour qu'une université puissent faire partie de votre classement. Je vous remercie.
Total of the score dominated by research, it is actually 68.25%., because in teaching band also covers 8.25% on directly research related. No score for Graduation or Masters records, though it is a condition to have undergraduate teaching. Could you please clarify my understanding? If any fee required to participate in ranking ?
Hi, How does THE obtain the data of the institutional research income? Is the data submitted by institutions? If so, how does THE validate the data? Thanks,
I am interested in how you are including the UN's sustainable development goals in your ranking. What matrix is being used to measure how Universities are having an impact on the Global Goals and their targets?
Hello, May I know if self-citations are included when calculating Citations scores? Thanks.
Hi. Which data source do you use for industry income (knowledge transfer? Is it the HE-BCi return Table 1.1 Collaborative Research and 1.2 Contract Research? Thanks. AD
Good day! Could you please let me know where can I find a breakdown of each indicator? For example, what categories of staff shall be considered as Research staff (shall we add to that range research assistants/instructors/teaching assistants?). Thanks in advance!

Sponsored