The fortunes of English universities are continuing to diverge, with major rises and contractions in student recruitment across institutions since the abolition of number controls, new Ucas figures show.
Ucas has today published its 2016 data on recruitment across individual universities.
Analysis by Times Higher Education shows that four English universities have seen their numbers of new UK and EU students fall by more than 30 per cent since 2011, the year before the government began to lift student number controls in England, creating much fiercer competition between institutions for students.
Ucas has also published detailed statistics on offer rates and entry rates by students’ sex, area background and ethnic group. These figures could shed light on debates about entry rates for poorer and ethnic minority students at prestigious institutions.
To judge risers and fallers in student numbers, THE compared total acceptance figures for UK and EU students in 2016 with those from 2011. Excluding small, specialist institutions and further education colleges, the five English institutions with the largest falls by percentage were all post-1992 universities. Three of those are London institutions (see below).
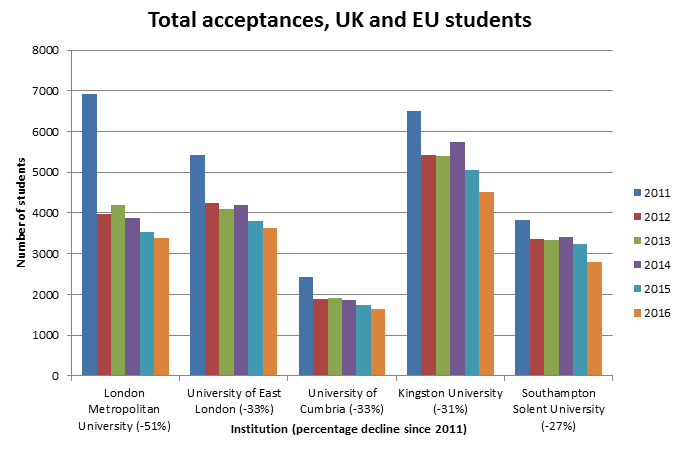
Student numbers saw a bumper year in 2011, which was the last year of entry before tuition fees trebled to £9,000, meaning that falls in 2012 appear more dramatic.
Successive years of declining recruitment could pose significant financial problems for institutions. However, some universities may opt to shrink recruitment if they are seeking to raise entry thresholds in a bid to improve their reputation.
The five English institutions seeing the biggest growth in UK and EU acceptances since 2011 are more of a mixed group in terms of their profile (see below).
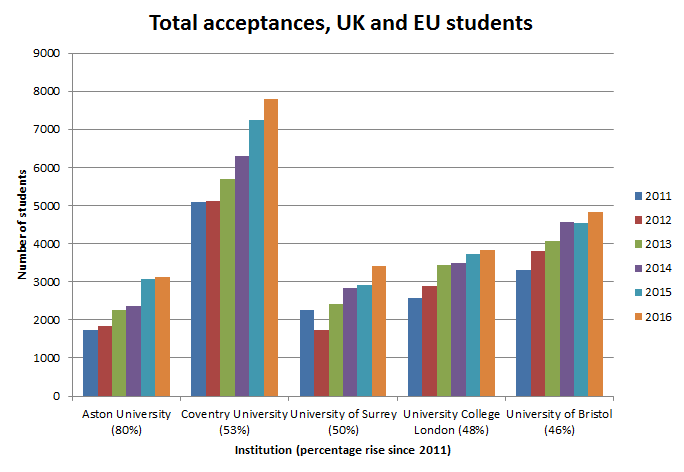
Aston University expanded numbers by 80 per cent over the period, while Coventry University, a post-1992 institution, has also grown its numbers by more than 50 per cent since 2011. Russell Group members University College London and the University of Bristol have also mounted significant expansion (although the former merged with the School of Pharmacy and the Institute of Education in this time, which accounts for some of its growth).
Mark Corver, director of analysis and research at Ucas, presented the below graph during a press briefing on the figures, showing in more breadth the shifts in the recruitment market since the government began to lift student number controls.
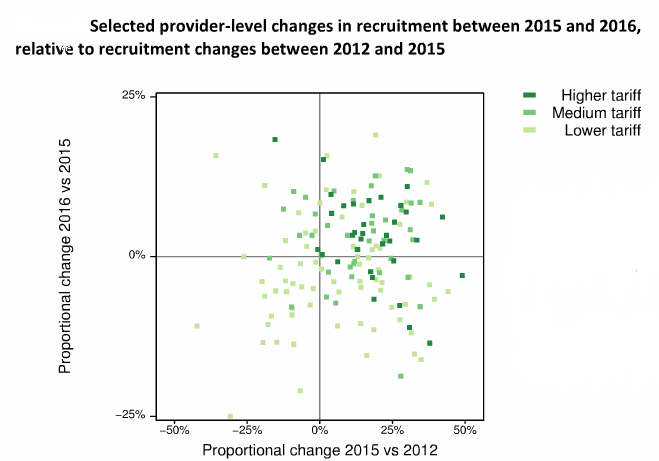
This suggests that it is not only high-tariff institutions that have been able to expand, with some medium-tariff and lower-tariff institutions growing numbers. But those seeing the most consistent and sharpest falls in student numbers are mainly lower-tariff institutions.
The Ucas data also make it possible to compare individual universities in terms of offer rates for male and female students, and for students from different ethnic groups and different socio-economic backgrounds.
Mr Corver explained that the key figure to look at is the difference between the offer rate (offers of admission as a proportion of all applications) for such groups, and the average offer rate for all students.
There is a Ucas tool for judging whether such differences are statistically significant. Mr Corver cautioned that small differences are likely to be “random noise”.
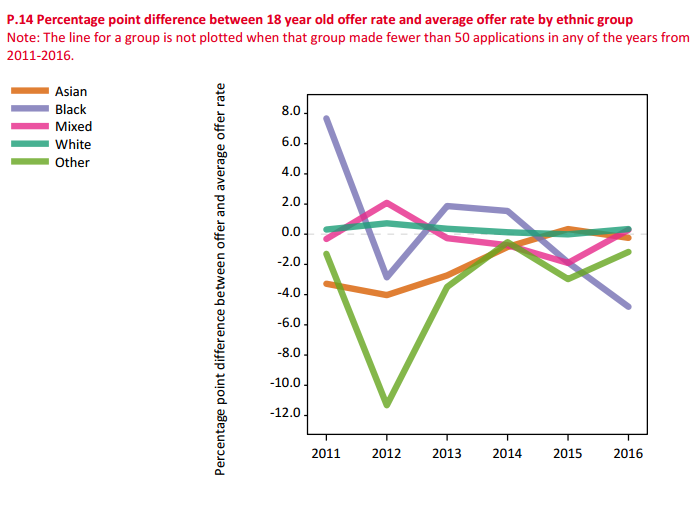
The University of Oxford has been under scrutiny for its record on admissions of ethnic minority students. The Ucas data show Oxford’s offer rates for different ethnic groups, against the average offer rate for all students (see below).
The numbers of applications to Oxford made by black students are low: 270 in 2016, the Ucas figures show. There were 1,200 applications from Asian students, who see the biggest gap between their offer rates and the average at Oxford (along with the “other” group). This gap of 4 percentage points for Asian students is statistically significant, when judged against the “look up” table provided by Ucas, which shows the gaps that might be expected according to numbers of applications and offer rates.
This means that the gap in offer rates for Asian students is unlikely to have occurred by chance. Speaking generally, Mr Corver explained at the briefing, statistically significant gaps may come down to factors such as personal statements or interviews.
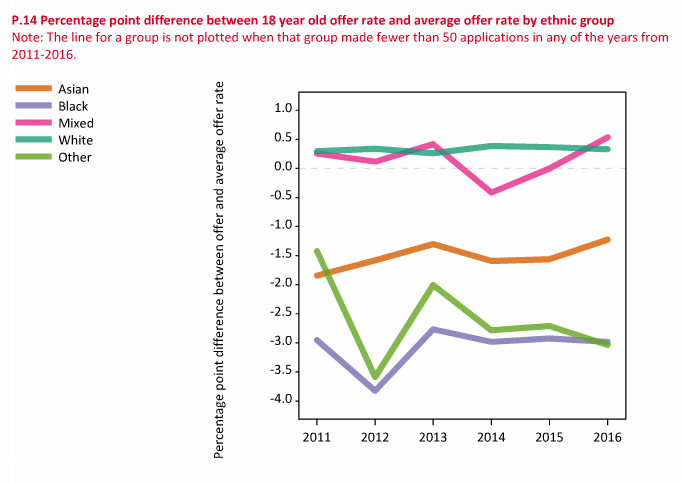
At the University of Cambridge, black students have the lowest offer rates (see below).
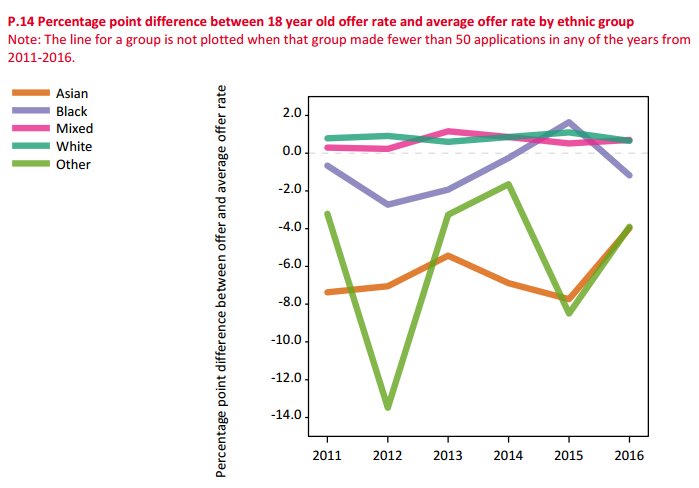
Mr Corver also provided a graph showing the differences in offer rates for different ethnic groups applying to higher-tariff institutions (see below). This highlights the gap in the offer rates at higher-tariff institutions seen by black students and white students, for example.
Register to continue
Why register?
- Registration is free and only takes a moment
- Once registered, you can read 3 articles a month
- Sign up for our newsletter
Subscribe
Or subscribe for unlimited access to:
- Unlimited access to news, views, insights & reviews
- Digital editions
- Digital access to THE’s university and college rankings analysis
Already registered or a current subscriber?