
Nothing gets the higher education policy community going like a good old-fashioned row about funding. Do universities get enough money compared with schools and higher education institutions in other countries? Do they spend enough of it on their students? Does research divert resources away from the teaching of undergraduates?
No surprise then that a recent article in The Observer criticising universities in England for a perceived failure to improve teaching, despite what – on the face of it – looks like a very generous funding settlement since tuition fees were tripled to £9,000, put the cat among the pigeons.
The article was published a day before a report by the Institute for Fiscal Studies revealed per student and pupil funding from pre-school to university. The comparison did appear to paint a growing picture of plenty for higher education relative to its sister sectors, especially in the recent “austerity” years when public funding has been constrained.
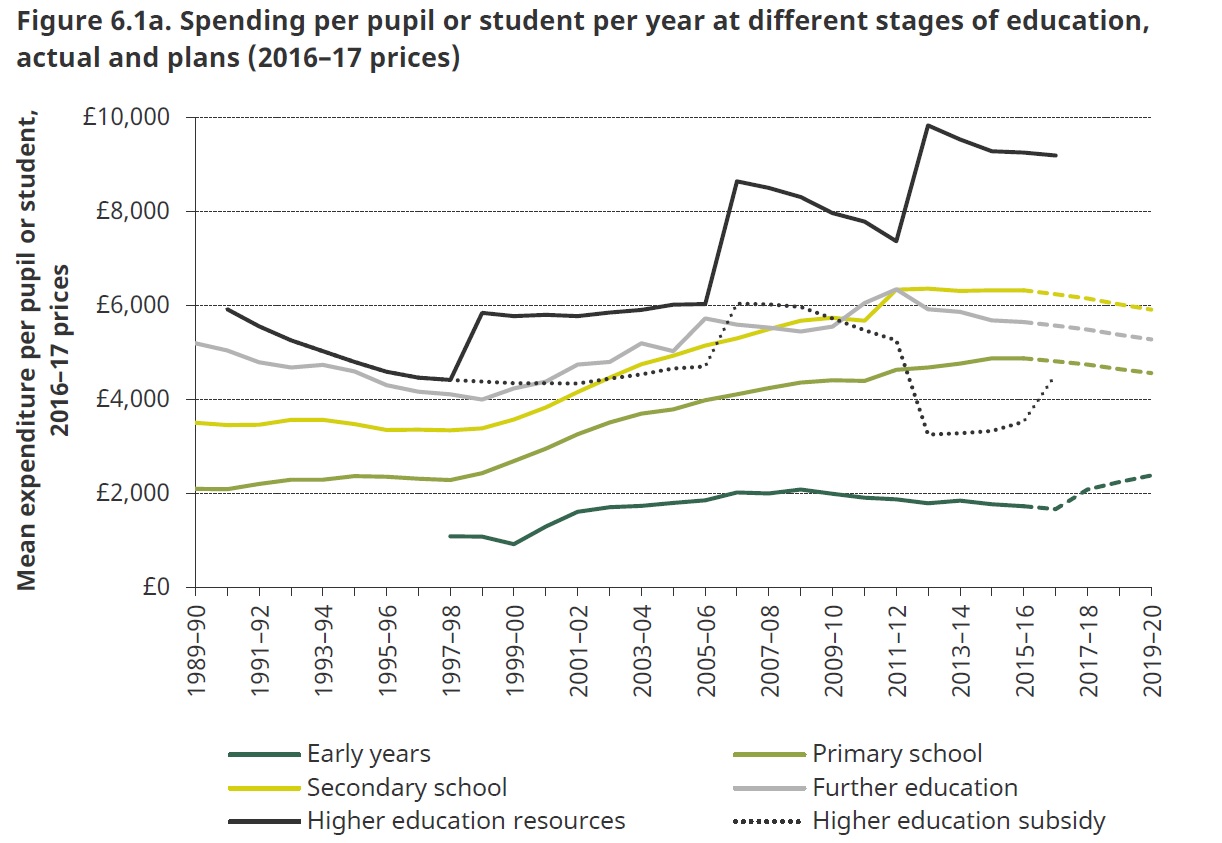
The key reason for this uplift is the switch – in two main tranches: 2006 and 2012 – from direct funding for teaching from the government towards private funding from students in the form of higher tuition fees. The IFS used an approach of considering “total” resources available to universities per student by including the face value of these fees. Although the IFS comparison between sectors shows how the level of public subsidy in higher education (mainly now in the form of unpaid student loans) has fallen below primary, secondary and further education, in terms of total resources available per student, universities do seem to be sitting pretty.
Such an approach does leave out one key factor though: research funding. The IFS analysis states from the outset that its “preferred measure” of per student funding for higher education is to exclude this and focus instead on resources for teaching. However, the reality is that universities receive their income from a variety of sources – research grants, tuition fees, industry income and others – and do not ring-fence each income source for spending on that area.
Therefore – and especially given that many people would argue that the unique teaching model of universities is that research informs learning – any comparison should arguably look at the whole per-student spend.
So looking at this measure, how do universities in England – or more broadly the UK – fare?
A crude calculation dividing total income for universities by total student numbers shows that this funding still rose after fees were tripled in England in 2012-13, even adjusting for inflation.
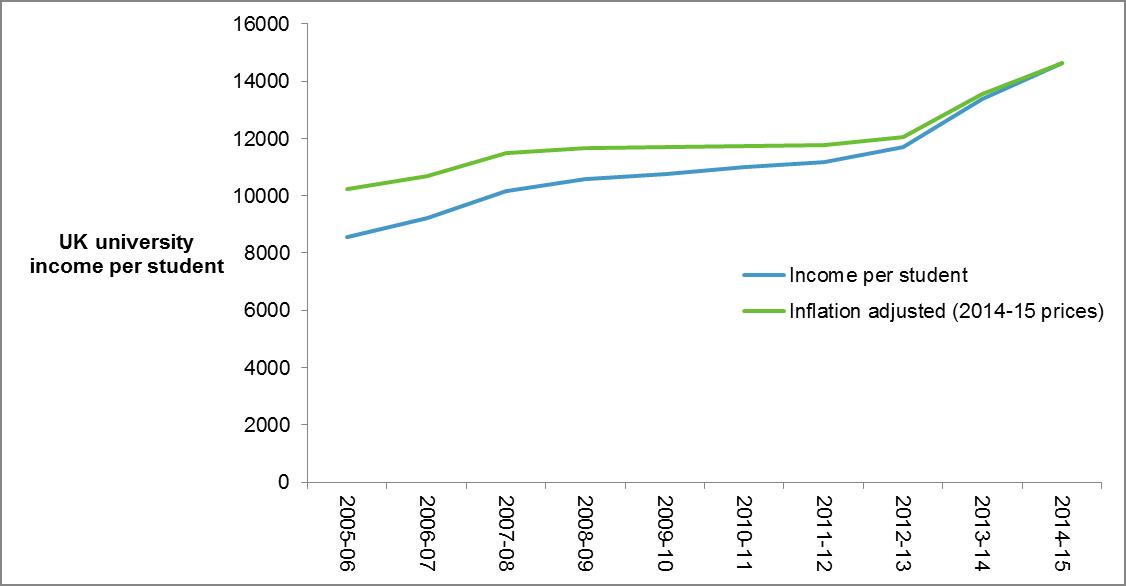
However, before 2012-13, this overall per-student funding for UK universities, including research income, stagnated for several years.
At the same time, isolating research income figures for UK universities for the period clearly shows that the amount of money available for this side of higher education was flatlining, and even falling (except for research money from the European Union) in real terms before £9,000 fees were introduced.
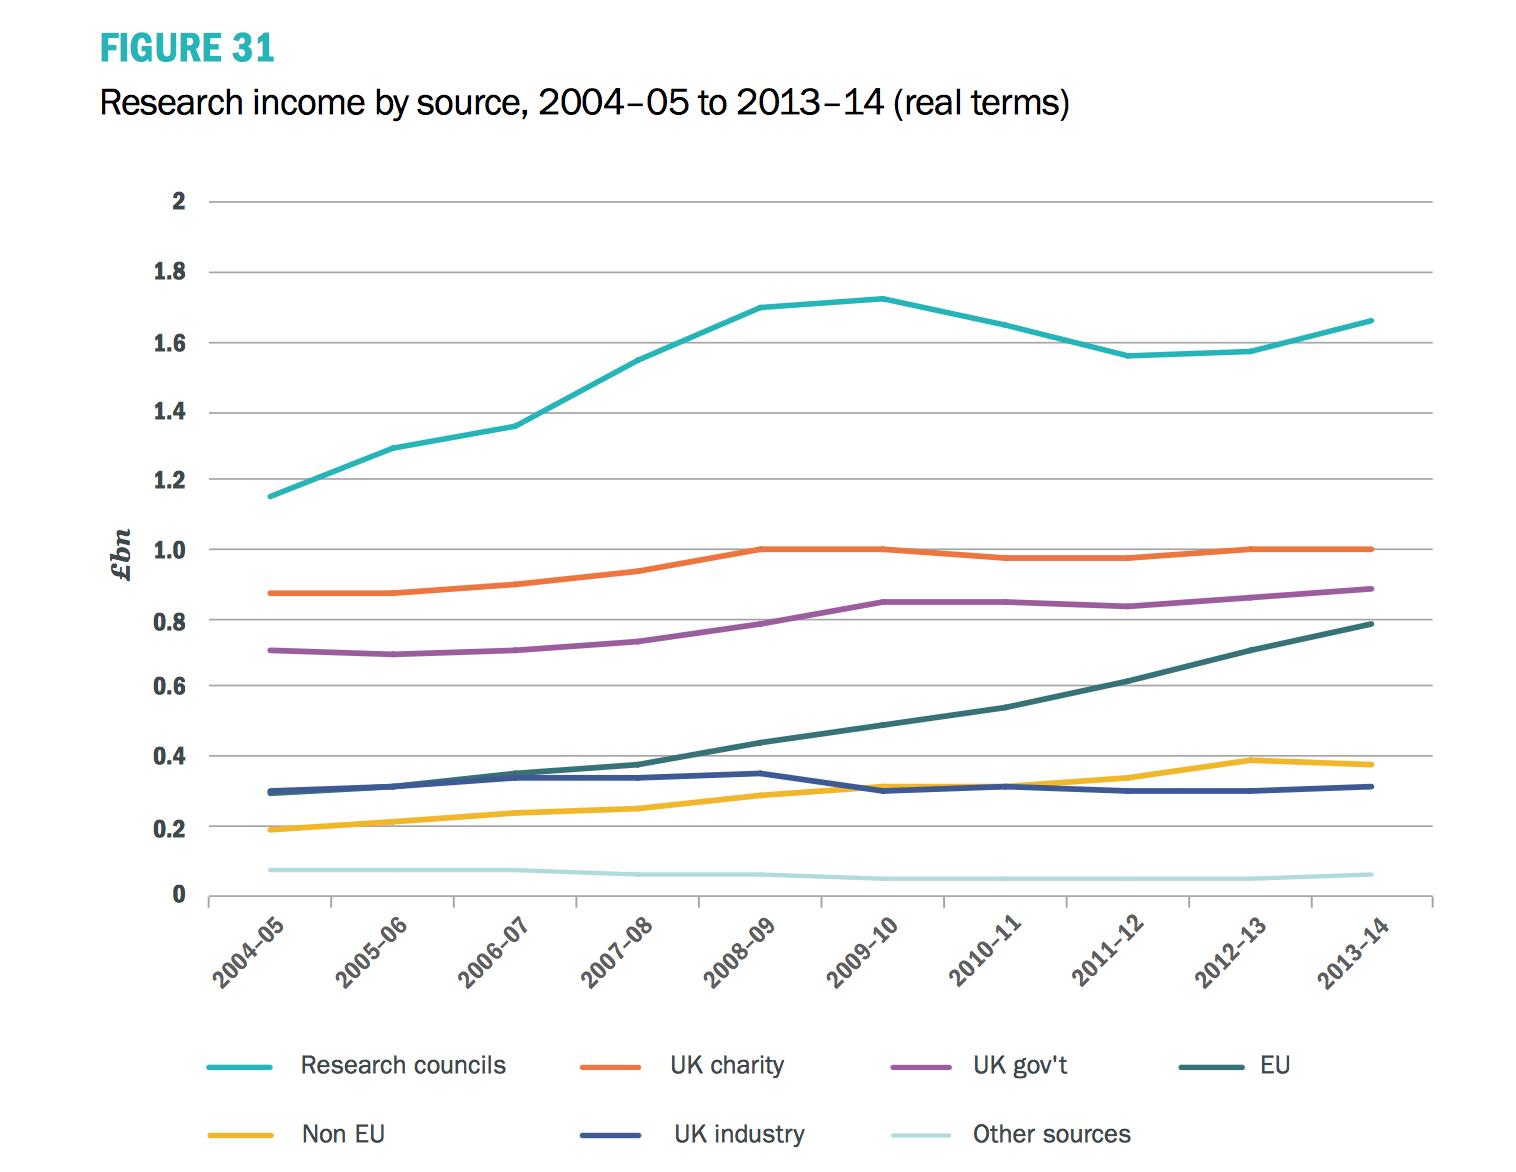
So when the windfall of higher tuition fees arrived, it is not beyond the realms of possibility that much of this money was diverted to fund a starved research landscape.
Including research income in calculations about higher education funding per student does mean comparisons with schools and further education arguably become more meaningless. After all, schoolteachers do not spend time doing research. But one way to discover whether the UK is unusual in its current disparity between funding for higher education and schools is to look at international comparisons.
The Organisation for Economic Cooperation and Development’s Education at a Glance publication does compare higher education funding per student with schools spending across countries.
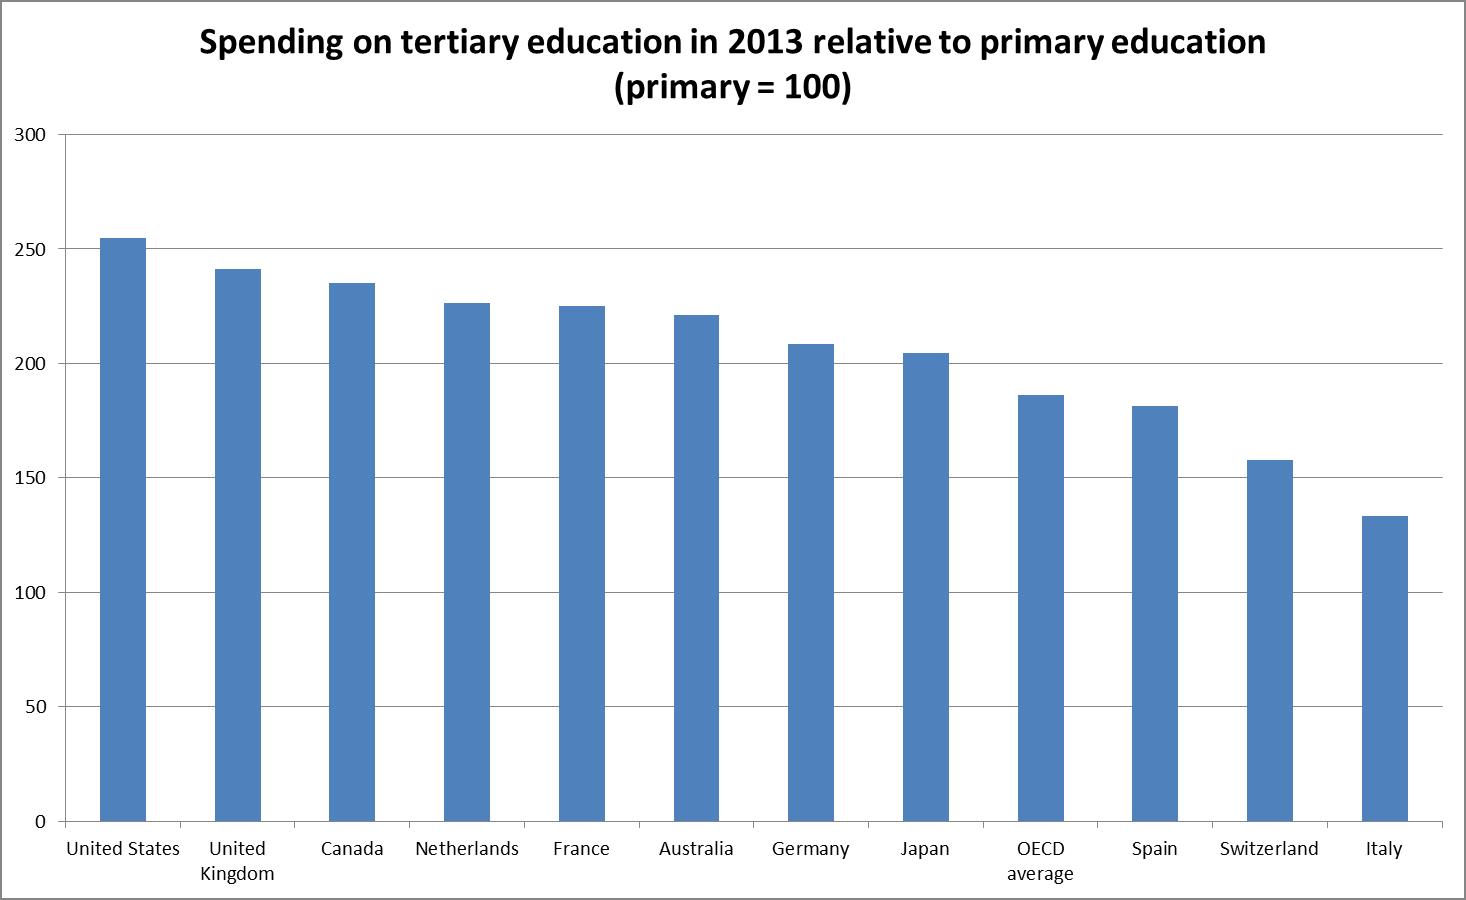
These statistics, which include the amount of money available for research, show that like the UK, the most successful higher education systems in terms of those with highly ranked universities (such as the US, Canada, the Netherlands and Germany) spend twice as much per student in universities than in primary schools.
So such a difference is hardly unusual and may well be explained by the importance of research to higher education. Indeed, the OECD estimates in last year’s Education at a Glance report that on average almost one-third (31 per cent) of spending on tertiary-level education goes towards research and, in some countries such as Switzerland, this proportion is more than half.
In essence, looking at the international comparisons show that it is not always that helpful just to look at fee increases in England in recent years and conclude that universities are swimming in cash and that teaching should therefore be outstanding. The funding changes feed into a bigger picture for UK higher education where levels of investment overall – for teaching and research – have arguably been brought back in line with competitor countries.
Find out more about THE DataPoints
THE DataPoints is designed with the forward-looking and growth-minded institution in view
Register to continue
Why register?
- Registration is free and only takes a moment
- Once registered, you can read 3 articles a month
- Sign up for our newsletter
Subscribe
Or subscribe for unlimited access to:
- Unlimited access to news, views, insights & reviews
- Digital editions
- Digital access to THE’s university and college rankings analysis
Already registered or a current subscriber?
