
Browse the full Times Higher Education Latin America University Rankings 2018 results
One of the ways we evaluate universities is by looking at their published output.
This type of bibliometric measure has a long history, and there are various things we could choose to explore – from simple measures like a count of papers or citations to more complex ones like the h-index.
There are also decisions to be made about the scope of this exploration. What types of publications and sources should we use?
In the Times Higher Education World University Rankings, we’ve chosen to use a “snowball metric” – field-weighted citation impact. This is quite complex – it measures the relative impact of a paper within its subject area, year of publication and publication type. In practice, this gives us a matrix of 8,600 cells into which a publication may fall.
For each cell, we calculate the average number of citations received by a paper, and then the ratio of the citations of a specific paper to this average.
The final step is to calculate the average value of publications associated with a particular university.
This seems to be a strong measure – it is “objective”, the calculation minimises subject-specific issues (such as the relatively low citation count for papers in the arts and humanities compared with the sciences), and it is available across all research-intensive universities. So why would we want to change it?
Well, as we explore the data we see some oddities, both at the publication level and also at the university level.
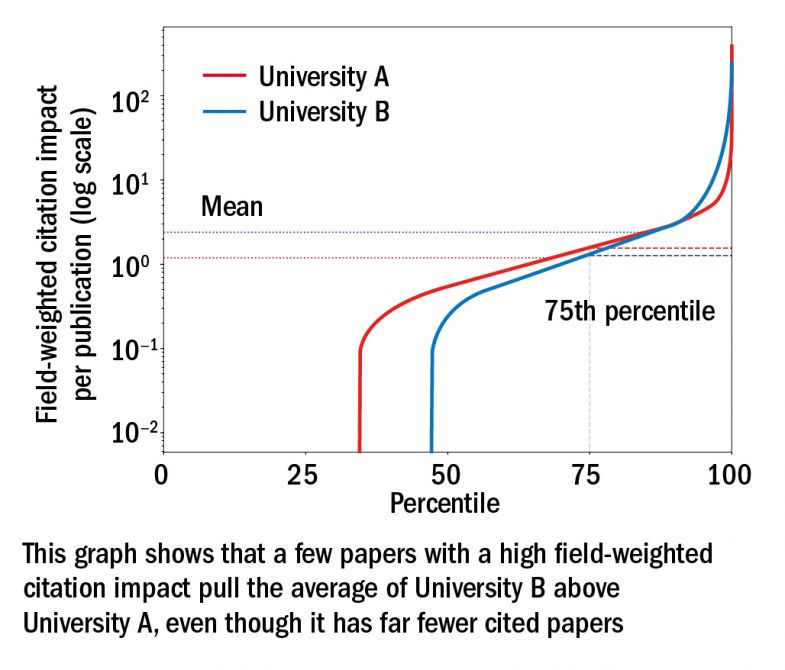
In terms of papers, the first, and somewhat depressing, insight is that most papers are never cited. And of those that are, a small percentage have a huge number of citations. This causes problems when we look at using the average FWCI of a university.
A few, very highly cited papers can raise the score of a university significantly without being typical of that university’s output. If those papers drop out of the time period we analyse (each edition of the ranking analyses publications indexed over the previous five years), a university may see significant changes to its score from one year to the next.
So what could we do? Well, instead of employing the average, we could use the median. This is a preferred approach in the world of statistics when looking at this type of distribution – and is why statistical agencies tend to look at median rather than mean salaries.
But we can’t do that. Our median (for most universities) would be zero.
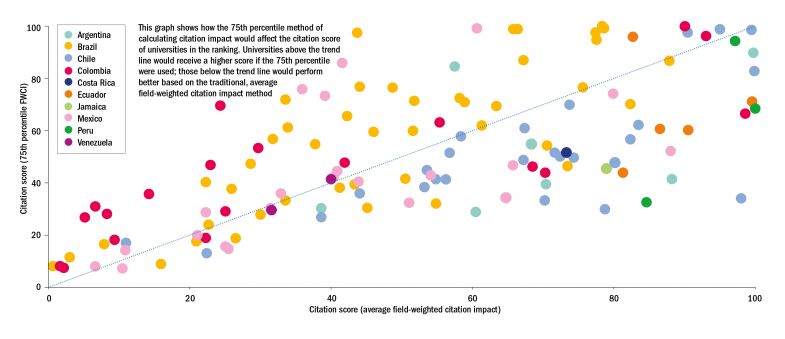
However, if we’re looking at a measure based on a percentile there is no specific reason to choose the 50th percentile (the median) – so instead we’re exploring the 75th percentile (see graph below).
This alternative approach would produce much greater stability in our Latin America University Rankings in particular; universities in this ranking are even more susceptible to year-on-year changes in citation count as the table’s lower eligibility criteria mean that they need to publish only 200 papers in a five-year period (down from 1,000 in the World University Rankings).
Of course there will be winners and losers (we can see some of the potential impact in the graph below).
Another benefit of this alternative approach is that it would allow us to fully reincorporate “kilo author papers” – big science papers with thousands of authors. We currently use a fractional counting approach to deal with these articles, so they do not have a disproportionate impact on the citation scores of a small number of universities, but moving to a single approach across all publications seems the right thing to do.
And one final positive – we could open our rankings more widely. If this approach provides stability to the citation count of universities with fewer than 1,000 papers, then there is no reason for us to exclude universities that are en route to research excellence.
To share your views, email profilerankings@timeshighereducation.com
Duncan Ross is data and analytics director, Times Higher Education
Register to continue
Why register?
- Registration is free and only takes a moment
- Once registered, you can read 3 articles a month
- Sign up for our newsletter
Subscribe
Or subscribe for unlimited access to:
- Unlimited access to news, views, insights & reviews
- Digital editions
- Digital access to THE’s university and college rankings analysis
Already registered or a current subscriber?