
Browse the full results of the Arab University Rankings 2023
The Times Higher Education World University Rankings are the only global performance tables that judge research-intensive universities across all their core missions: teaching, research, knowledge transfer and international outlook.
The methodology behind the Arab University Rankings is based on the same comprehensive and trusted framework as the global table, but some important adjustments have been made and some new metrics have been included to reflect the features of universities in the Arab region.
This third edition of the rankings introduces significant updates to the original methodology, in line with the changes made to the World University Rankings methodology this year. These improvements ensure that the rankings continue to reflect the outputs of the diverse range of research-intensive universities across the world, now and in the future.
We have moved from 16 to 20 carefully calibrated performance indicators (listed below). Two of the metrics (study abroad and patents) currently have zero weight but might be considered in future. The performance indicators are still grouped into five areas, but some of the names have been updated.
Some changes to institutions' scores will be influenced by these methodological changes and we would advise noting that when making comparisons with previous year's results.
The full methodology is published in the file at the bottom of this page.
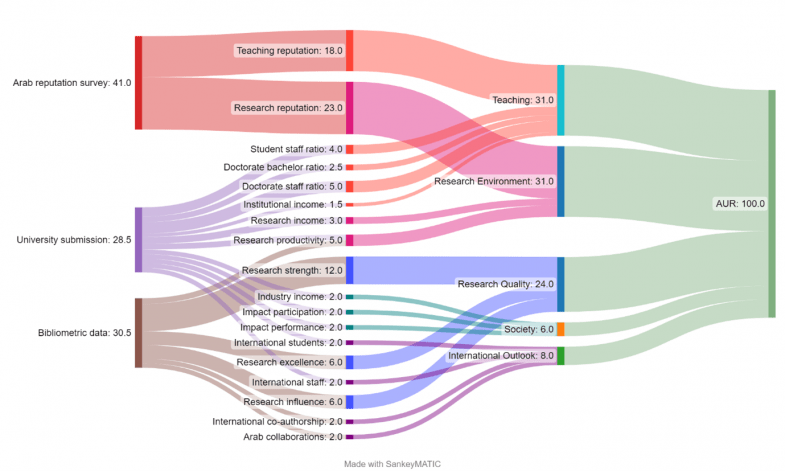
Teaching (the learning environment): 31%
- Teaching reputation: 18%
- Doctorates awarded-to-academic-staff ratio: 5%
- Academic staff-to-student ratio: 4%
- Doctorates awarded-to-undergraduate degrees awarded ratio: 2.5%
- Institutional income per academic staff: 1.5%
The Arab Reputation Survey that underpins this pillar was carried out in May and June 2023 and yielded more than 35,000 votes. Only academics in the Arab region who had been cited in published papers were invited to participate. This exercise examined the perceived prestige of institutions in teaching and research. The teaching reputation metric is based on the number of teaching votes obtained from the 2022 and 2023 Arab Reputation Surveys. Universities that received no votes score zero for this metric.
As well as giving a sense of how committed an institution is to nurturing the next generation of academics, a high proportion of postgraduate research students also suggests the provision of teaching at the highest level that is thus attractive to graduates and effective at developing them. This metric is generated by dividing the total subject-weighted number of doctorates, by the total subject-weighted number of academic staff (as the volume of doctoral awards varies by discipline). The metric is normalised after calculation.
The academic staff-to-student ratio is defined as the total full-time equivalent (FTE) number of staff employed in an academic post divided by FTE number of students in all years and of all programmes that lead to a degree, certificate, university credit or other qualification. This variable and the doctorates awarded-to-undergraduate degrees awarded ratio are normalised after calculation.
Institutional income indicates an institution’s general status and gives a broad sense of the infrastructure and facilities available to students and staff. This metric is generated by dividing the institutional income adjusted to purchasing-power parity (PPP), by the total number of academic staff. This variable is normalised after calculation.
Research environment: 31%
- Research reputation: 23%
- Publications per staff: 5%
- Research income per academic staff: 3%
The most prominent indicator in this category looks at a university’s reputation for research excellence among its peers, based on the responses to our Arab Reputation Surveys (see above).
To measure productivity, we count the number of publications published in the academic journals indexed by Elsevier’s Scopus database per scholar, scaled for institutional size and weighted by subject. This gives a sense of the university’s ability to get papers published in quality peer-reviewed journals. This measure includes a method to give credit for cross-subject research that results in papers being published in subjects where a university declares no staff.
Research income is scaled against academic staff numbers and adjusted for purchasing-power parity (PPP). This is a somewhat controversial indicator because it can be influenced by national policy and economic circumstances. But income is crucial to the development of world-class research, and because much of it is subject to competition and judged by peer review, our experts suggested that it was a valid measure. This indicator takes account of each university’s distinct subject profile, reflecting the fact that research grants in science subjects are often bigger than those awarded for the highest-quality social science, arts and humanities research.
Research quality: 24%
- Research strength: 12%
- Research excellence: 6%
- Research influence: 6%
Our research quality pillar looks at universities’ role in spreading new knowledge and ideas.
We examine research quality by capturing the number of times a university’s published work is cited by scholars globally. This year, our bibliometric data supplier Elsevier examined more than 134 million citations to 16.5 million journal articles, article reviews, conference proceedings, books and book chapters published over five years. The data include more than 27,950 academic journals indexed by Elsevier’s Scopus database and all indexed publications between 2018 and 2022. Citations to these publications made in the six years from 2018 to 2023 are also collected.
We consider the field-weighted citation impact (FWCI) for each institution, per subject and overall. The research strength score used in the ranking is determined by calculating the 75th percentile FWCI score of all papers published by each institution. We believe that this gives a more stable measure over time when compared with the mean average and prevents the distorting effect of a few papers with very high numbers of citations.
The data are normalised to reflect variations in citation volume between different subject areas. This means that institutions with high levels of research activity in subjects with traditionally high citation counts do not gain an unfair advantage.
Two new citation measures have been introduced in 2023. Our research excellence metric recognises an institution’s contribution to the best research in each subject and overall. Excellence is measured by capturing the total number of publications by an institution that are among the top 10% of publications worldwide by FWCI. We adjust this number by year, subject and the total number of academic and research staff.
Finally, research influence examines the influence of an institution’s publications by analysing their corresponding citations. The importance of a publication is determined based on the importance of other papers citing it. We adjust this number by year, subject and the total number of academic and research staff.
These three metrics help to show us how much each university is contributing to the sum of human knowledge: they tell us whose research has stood out, has been picked up and built on by other scholars and, most importantly, has been shared around the global scholarly community to expand the boundaries of our understanding, irrespective of discipline.
International outlook: 8%
- Proportion of international students: 2%
- Proportion of international staff: 2%
- International co-authorship: 2%
- Collaboration within the Arab world: 2%
The ability of a university to attract undergraduates, postgraduates and faculty from all over the planet is key to its success on the world stage.
International students and staff are defined as those whose nationality differs from the country where the institution is based. The first two metrics are calculated as the total FTE number of international students or staff divided by the total FTE number of students or staff.
In the third international indicator, we calculate the proportion of a university’s total research journal publications that have at least one international co-author and reward higher volumes. This metric accounts for an institution’s subject mix and uses the same five-year window as the “Research quality” category.
The final metric is similar to the international co-authorship measure, but it looks at only universities within countries in the Arab region: Algeria, Bahrain, Comoros, Djibouti, Egypt, Iraq, Jordan, Kuwait, Lebanon, Libya, Mauritania, Morocco, Oman, Palestine, Qatar, Saudi Arabia, Somalia, Sudan, Syria, Tunisia, the United Arab Emirates and Yemen.
Historically, large countries have been disadvantaged compared with small countries in our international metrics, in that it is “easier” for staff and students in small countries to work/study abroad. This has led us to change our normalisation approach for the four measures in 2023, henceforth taking into consideration the population of a country when evaluating these metrics.
A study abroad metric – assessing the provision of international learning opportunities for domestic students – complements the International outlook pillar, but is currently given a weight of 0%.
Society: 6%
- Industry income per academic staff: 2%
- Impact Rankings participation: 2%
- Impact Rankings performance: 2%
A university’s ability to help industry with innovations, inventions and consultancy has become a core mission of the contemporary global academy. The industry income metric seeks to capture such knowledge-transfer activity by looking at how much research income an institution earns from industry (adjusted for PPP), scaled against the number of academic staff it employs. This suggests the extent to which businesses are willing to pay for research and a university’s ability to attract funding in the commercial marketplace – useful indicators of institutional quality.
Another mission of many higher education institutions is to positively impact wider society. In this ranking, this is defined as their contributions towards the United Nations’ Sustainable Development Goals (SDGs), as measured by the THE Impact Rankings. Participation is measured by calculating the number of SDGs for which an institution is ranked in the latest THE Impact Rankings. A maximum of 100 points is awarded to institutions that participate in four SDGs or more; 80 points for three SDGs; 60 points for two SDGs; 50 points for one SDG and zero points if they are not ranked.
For the performance metric, institutions that are ranked in the overall table of the latest Impact Rankings receive a metric score that is the same as their overall score in the table. Institutions that are not ranked in the overall table receive zero points for this metric.
A patents metric – assessing the extent to which universities are supporting their national economies through technology transfer and defined as the number of patents citing research conducted by the university – complements the Society pillar but is currently given a weight of 0%.
Data collection
Institutions provide and sign off their institutional data for use in the rankings. On the rare occasions when a particular datapoint is not provided, we enter a conservative estimate for the affected metric. By doing this, we avoid penalising an institution too harshly with a “zero” value for data that it overlooks or does not provide, but we do not reward it for withholding them.
Getting to the final result
Moving from a series of specific datapoints to indicators and then to a total score for an institution requires us to match values that represent fundamentally different data. To do this, we use a standardisation approach for each indicator, and then combine the indicators in the proportions shown above.
The standardisation approach we use is based on the distribution of data within a particular indicator, where we calculate a cumulative probability function, and evaluate where a particular institution’s indicator sits within that function.
For most indicators, we calculate a normal cumulative probability function. Impact Rankings participation is scored by counting the number of Sustainable Development Goals that the universities participated in in the Impact Rankings 2023. The distribution of data in the metrics on teaching reputation, research reputation, research strength, research excellence and patents requires us to use an exponential scoring function.
Rankings table
Precise ranks and overall scores are shown for the institutions ranked in the top 50. We then display banded ranks and overall scores for institutions in the rest of the table because the difference between their scores is not statistically significant.
A small number of institutions have “reporter” status and are listed at the bottom of the table. This means that they provided data but did not meet our eligibility criteria to receive a rank.
Exclusions
Universities must supply data to be included in the ranking. They also must have published more than 500 research publications between 2018 and 2022.
The Arab University Rankings considers only institutions that are based in the following countries: Algeria, Bahrain, Comoros, Djibouti, Egypt, Iraq, Jordan, Kuwait, Lebanon, Libya, Mauritania, Morocco, Oman, Palestine, Qatar, Saudi Arabia, Somalia, Sudan, Syria, Tunisia, the United Arab Emirates and Yemen.
Register to continue
Why register?
- Registration is free and only takes a moment
- Once registered, you can read 3 articles a month
- Sign up for our newsletter
Subscribe
Or subscribe for unlimited access to:
- Unlimited access to news, views, insights & reviews
- Digital editions
- Digital access to THE’s university and college rankings analysis
Already registered or a current subscriber?