The radically altered picture of graduate employment prospects that emerged from the reclassification of jobs for league tables published in The THES last spring was no flash in the pan, a more detailed study confirms.
An analysis of five years' data shows remarkable consistency in subjects whose students enjoyed the most "positive outcomes" six months after graduation. The term covers further study and traditional graduate jobs, and graduate-track jobs, but excludes non-graduate occupations.
The methodology was used for the first time in the compilation of The Times Good University Guide 2004 . Previous comparisons of graduate destinations had not distinguished between different types of employment.
This article examines longitudinal shifts in this measure within subjects between 1997 and 2002. It is probably here that the more exaggerated claims are made by proponents of some disciplines, seemingly unaware of the hard facts returned in the official survey completed by graduates themselves.
The following trends have been identified:
* The top ten subjects (table 1) show great consistency over the five years, with eight (mainly medicine and allied professions, but also architecture and education) appearing every year and three others (building, civil engineering and law) appearing in two or more years
* The bottom ten subjects (table 1) display less consistency, with four appearing in all five years, and three each appearing in one or more years.
They include some of the most popular subjects, such as communications and media studies, environmental science and psychology. They also include art and design, dance and cinematics, and sociology, where often the traditional route to relevant careers is via hands-on work experience categorised as non-graduate level
* The new definition of graduate destinations (restricted to graduate and graduate-track jobs) gives very different results for some subjects compared with the previous definition that included all jobs. Subjects that show above-average positive destinations using the old definition methodology but now fall below the line are listed on table 2
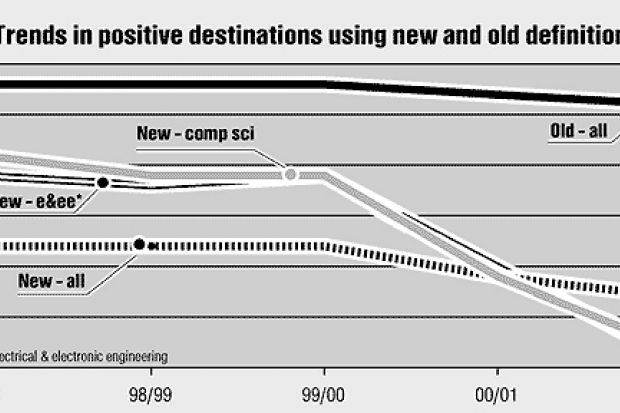
* Both methodologies record slight increases in positive graduate destinations up to 2000, followed by a steady decline to 2002. However, computer science and, to a lesser extent, electrical and electronic engineering show an even greater decline in the new rank order over the period, perhaps reflecting the fortunes of the dotcom sector.
We have sought to determine whether there is a relationship between these trends in positive graduate destinations and simple economic indicators such as gross domestic product, retail price index and national unemployment figures, and find a reasonable correlation with GDP only.
The latest study is the third in a series of longitudinal analyses of material collected by the Higher Education Statistics Agency from universities. The first two examined the changes in class of degree awarded and of A-level entry standards in individual universities.
The data used to compile the tables on this page derive from the First Destination Survey of UK-domiciled first-degree graduates and leavers available annually from Hesa. The data have their shortcomings, not least the fact that they span only the period from graduation to January 31 following, but this material has been continuously collected for almost 50 years, is of high quality and is used by stakeholders, including the government and universities.
Indeed, while the original raison d'être was internal to university careers guidance and placement programmes, the FDS has long since assumed as great a significance among workforce planners and researchers. The FDS outcome has also been of growing concern to university applicants and their parents as paying consumers. It is not surprising, therefore, that university rankings in broadsheet newspapers include a graduate destinations measure based on the FDS return.
The Times Good University Guide is no exception and, until this year, used the proportion of UK graduates obtaining any employment or further study.
However, its league tables of university and subject rankings published last May included a modified employment element based on the work of Abigail McKnight and her co-workers at the Institute for Employment Research at Warwick University.
The IER researchers took the Standard Occupational Classification used in the FDS and, with reference to the national Labour Force Survey , allocated each of the job titles within the SOC to one of three categories: graduate, graduate track or non-graduate occupations. The rationale for this was based on consideration of typical entry requirements plus the average level of qualifications held by employees in each occupation.
Our new measure excludes non-graduate occupations. The full 2001-02 results for the 62 subjects listed in The Times Good University Guide are shown in table 4. It is obvious that the new methodology gives a more sensitive delineation, with a greater spread of outcomes, but it should be noted that small graduate numbers in some subjects (such as Asian, African and some European languages) could give a false picture.
The move this year from any employment to graduate plus graduate-track employment in our graduate destinations measure for The Times Good University Guide 2004 rankings excited little criticism and much interest.
It is likely, therefore, that we will use this definition again next year, with minor modification. However, the FDS is itself undergoing a substantial revision, so we may have to review the detail of our methodology, but we will want to retain an insight into what graduates do.
Bernard Kingston is a partner in Mayfield University Consultants (b.kingston@mayfield-uc.org.uk). </a> Background information provided by Nicola Bright of Bright Statistics and Abigail McKnight (now at the LSE).
The Times Good University Guide is published by HarperCollins.
FIRST-DEGREE GRADUATE EMPLOYMENT, 1997-2002
Table 1
Positive destinations for top ten and bottom ten subjects
Top 97/98 98/99 99/00 00/01 01/02 Architecture Dentistry
Education Medicine Nursing Other subjects allied to medicine Pharmacology & pharmacy Veterinary medicine Building Civil engineering Law Bottom 97/98 98/99 99/00 00/01 01/02 American studiesArt & DesignDrama, dance & cinematicsSociologyAnthropology Italian Psychology Environmental science History of art, architecture & design Philosophy Communications & media studies Russian Social policy Iberian languages Linguistics Middle East & African studies
Table 2
Subjects with above average old but below average new outcomes
Subject Total graduates Old (n) Old (%) New (n) New (%**) Materials technology3,8333,56993.12,87675.0Hospitality & tourism10,4869,80693.57,08667,6English22,79421,11692.615,51568.1French3,7923,55593.82,732.0German1,3491,794.7982.8Italian39236392.624061.2Music7,5817,13094.15,56373.4Geography17,62916,47793.512,17469.1Psychology24,67522,84192.616,09365.2 All subjects 760,398 703,377 92.5 572,672 75.5
** Percentage with positive destinations.
Table 3
Trends in positive destinations using new and old definitions
<BR clear=all>
Table 4
Old outcome methods versus new measures by subject (2001-2002)
<P align=left> Subject
Total graduates* Old (%**) Rank New (%**) Rank
Dentistry
637
99.5
2
99.4
1
Medicine
41
99.8
1
99.3
2
Nursing
2908
99.0
3
98.1
3
Veterinary medicine
459
96.1
7
95.6
4
Pharmacology & pharmacy
1691
97.8
4
93.6
5
Architecture
1024
95.3
11
90.5
6
Civil Engineering
1048
94.8
12
89.2
7
Other subjects allied to medicine
5454
96.7
6
89.1
8
Education
6930
97.2
5
88.2
9
Building
1139
93.4
18
87.2
10
Food science
498
96.0
8
84.3
11
Land & property management
208
91.8
30
83.7
12
Social work
1168
94.7
13
83.5
13
Chemical engineering
517
91.5
32
83.0
14
Law
61
95.4
10
82.9
15
Celtic studies
109
95.4
9
81.7
16
Chemistry
2228
92.6
25
81.4
17
Town & country planning and landscape
880
94.2
15
79.9
18
Anatomy & physiology
1059
94.1
16
78.0
19
Materials technology
682
93.1
21
75.4
20
Mechanical engineering
1856
88.1
54
74.8
21
Middle Eastern & African Studies
45
80.0
62
73.3
22
Economics
2525
90.2
40
73.2
23
Theology & religious studies
656
93.4
17
73.2
24
Molecular biosciences
4171
93.3
19
73.1
25
General engineering
865
86.9
55
72.9
26
Physics & astronomy
1643
88.9
51
72.9
Mathematics
2838
89.9
44
72.4
28
Business studies
14711
91.6
31
70.9
29
Aeronautical & manufacturing engineering
1471
86.3
56
69.4
30
Music
1676
92.9
22
69.2
31
Geology
829
90.6
34
69.0
32
Linguistics
265
93.2
20
68.7
33
East & South Asian studies
105
90.5
36
68.6
34
Social policy
546
90.7
33
68.3
35
Librarianship & information management
182
85.7
57
68.1
36
Organismal biosciences
3748
90.4
38
68.0
37
Classics & ancient history
463
89.4
48
67.4
38
Computer science
8222
82.3
60
66.7
39
Politics
1813
90.1
42
66.6
40
Electrical & electronic engineering
2366
84.0
59
66.1
41
Agriculture & forestry
921
90.4
37
65.3
42
German
222
91.9
64.9
43
English
4675
91.9
29
64.7
44
Hospitality & tourism
1834
94.2
14
64.7
45
History of art, architecture & design
574
90.4
39
64.6
46
Geography
3636
91.9
28
64.6
47
Environmental science
1502
89.5
47
64.5
48
French
634
90.1
43
64.4
49
Archaeology
513
89.7
46
64.3
50
History
4039
90.2
41
63.8
51
Philosophy
669
89.2
49
63.8
52
Psychology
5018
92.7
24
63.0
53
Sociology
3220
90.5
35
61.1
54
American studies
361
92.0
26
60.4
55
Anthropology
382
89.0
50
59.9
56
Russian
49
81.6
61
59.2
57
Iberian languages
3
88.6
52
58.6
58
Communication & media studies
2642
88.3
53
57.9
59
Drama, dance and cinematics
2115
89.8
45
57.6
60
Italian
82
92.7
23
56.1
61
Art & design
7287
84.6
58
54.9
62
All subjects
91.4
-
72.0
-
* Excludes graduates and leavers not available for employment or training. ** Percentage with positive destinations.
Register to continue
Why register?
- Registration is free and only takes a moment
- Once registered, you can read 3 articles a month
- Sign up for our newsletter
Subscribe
Or subscribe for unlimited access to:
- Unlimited access to news, views, insights & reviews
- Digital editions
- Digital access to THE’s university and college rankings analysis
Already registered or a current subscriber?