Academics and university administrators answered questions about how student success is measured, delivered and challenged
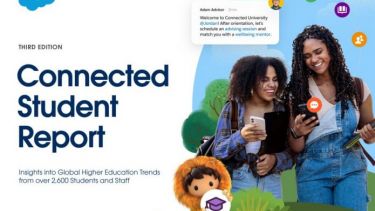
To complement the launch of Salesforce’s Advisor Link — a bespoke solution designed to give advisers and tutors the tools they need to collaborate more efficiently, understand students more deeply and build stronger journeys through graduation – Times Higher Education and Salesforce.org conducted a survey that gained insights from almost 300 higher education professionals. It revealed trends such as the most important factors in delivering student success and the challenges affecting its delivery.
Summary of respondents
The 295 respondents represent a range of leaders and administrators: 52 per cent from the UK, 17 per cent from mainland Europe and 31 per cent from the rest of the world.
Factors constituting student success strategies
Student employability, completion and satisfaction were the top three priorities identified for student success programmes. In the UK, this correlates with teaching excellence framework criteria, such as student satisfaction, retention and graduate employment.
Student diversity and inclusion and student wellbeing were ranked lower than student retention and student engagement, despite a likely causal link between them. These priorities may be diminished by other challenges, such as staff shortages, increased student numbers and/or a lack of funding.
Communication and implementation
The survey also addressed how student success programmes are measured, delivered and challenged in order to facilitate improvement.
Of the respondents, 43 per cent said that their university has no clear strategy for student success or that they don’t know about one. This may reflect problems in communicating that strategy rather than the absence of one.
Principals, deans and vice-chancellors were identified as defining student success programmes in 63 per cent of cases. Only 12 per cent of respondents identified a head of student success as defining their student success programmes.
Questions may be asked about whether a more collaborative approach yields greater awareness and results – and if such an approach can refine the “living documents”
that often constitute the guidelines for student success programmes.
Regardless of their structure, student success programmes must also aim to clearly define the roles and responsibilities of the parties involved.
As one respondent put it: “Success can only come through a sense of shared responsibility between faculty, administrators and students themselves.”
Market dynamics affecting student success
Multiple drivers for student success programmes were identified as contributing on a fairly equal basis: student expectations, government policies and industry demand.
Student demographic was the lowest-ranked driver, which arguably correlates with diversity and inclusion being ranked lower than other criteria in what contributes to student success programmes.
Alternatively, it may signify that the “non-traditional student” no longer exists and that universities now regard students as a diverse group of individuals.
One respondent remarked that it was important that student success strategies should take a “person-centred approach, avoid ‘dehumanising’ through a data-only driven approach [and] reward staff who facilitate success stories”.
The top-ranked barriers to improving student success were financial resources, staff resources and competing priorities across the university. Administrative silos, IT infrastructure and change management were also identified as barriers. An overlap between these different areas is likely and may vary depending on a university’s location, size, age and reputation.
The challenge that universities face to achieve their student success goals with limited resources and system integration emphasises the importance of economy of scale in higher education.
Staff collaboration and student data
Student support was identified as the most challenging metric to track, despite the fact that it and student engagement were identified as the most-tracked activities. This suggests that the monitoring process for student support could be refined to better serve the processes of student success programmes where this is the case.
The majority of respondents (32 per cent) said that it was “somewhat difficult” to access and report on student success data.
More than 60 per cent of respondents find student information by asking colleagues, browsing spreadsheets or other electronic documents, but 37 per cent found sharing and collaborating on student data “difficult” or “very difficult”.
The predominant academic advising model was a hybrid one of a centralised advising department and student-initiated contact (44 per cent). A centralised advising department with proactive student outreach was the next most common (29 per cent). This suggests that while infrastructure exists, challenges may be created or exacerbated by the way in which advising is managed.
How technology helps and hinders student success
Spreadsheets or electronic documents (69 per cent), student information systems (63 per cent) and colleagues (60 per cent) were the three most-common ways to find student information. However, the majority of respondents (32 per cent) said that it was “somewhat difficult” to share and collaborate.
Recommendations for improvements
1. The need for a shared road map
More than 75 per cent of respondents could not identify a technology road map to help them navigate student success.
2. Deeper integration between systems
Of the respondents, 40 per cent thought that deeper integration between multiple systems would improve team collaboration and efficiency. “Systems (IT, academic and support) don’t talk to [or] inform one another,” said one respondent.
3. A hybrid platform
To help improve student success, 62 per cent of respondents recommended the setting up of a learning management system, 60 per cent recommended student advising solutions and 59 per cent recommended analytics tools for business intelligence. This arguably identifies the limitations of certain learning management systems to deliver student success. “End-to-end customer relationship management,” was the recommendation of one respondent, while another cited the need for “bringing together all touchpoints in a single, user-friendly interface that is easily accessible.”
Learn more about the Salesforce.org Education Cloud
Watch the on-demand webinar: The Future of Student Success and Advising