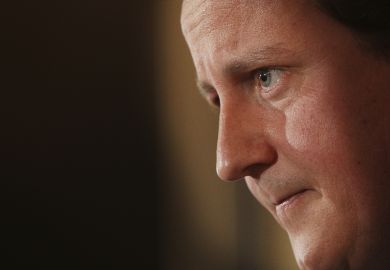
The University of Oxford is yet again under fire for its record on admissions, this time from a former student – David Cameron. On Sunday, the prime minister wrote in The Sunday Times that it was “striking that in 2014, our top university, Oxford, accepted just 27 black men and women out of an intake of more than 2,500”.
It was “not doing enough to attract talent from across our country,” he warned.
Although Mr Cameron also raised concerns about the small number of white men from poor backgrounds going to university, the subsequent debate has focused on whether Oxford, along with other institutions like the army and big companies, are guilty of racial discrimination, as the prime minister speculated might be the case.
In The Spectator, Toby Young defends Oxford against accusations of racism in its admissions process by arguing that overall, the university’s non-white intake reflects British society.
“British BME students still make up 13 per cent of the total. Maybe the Prime Minister is right and that figure should be higher – the average at Russell Group universities is around 18 per cent – but it exactly reflects the percentage of the British population that’s non-white – 13 per cent, according to the 2011 census,” he writes.
However, a closer look at the census data shows that the proportion of people who are non-white varied hugely with age – in England and Wales, 20 per cent of those aged 0 to 24 were non-white. Given that this is the age group from which our universities recruit the vast majority of their students, it seems like a better comparison point than the 13 per cent overall figure.
When you use these population stats for younger people, you find a less equitable picture than that painted by Toby Young. White youngsters make up 80 per cent of their age cohort, they constitute 85.6 per cent of UK-domiciled Oxford acceptances (using data from 2012-2014).
Yet this raw figure masks huge variations between different ethnic groups. The graph below shows the number of undergraduates accepted by Oxford from 2012-14 per 100,000 people of the same ethnicity aged up to 24. The higher the number, the better represented a group is at Oxford.

The data do show that black students are indeed under-represented at Oxford. However, mixed race applicants of white and black African background do about average, and the best represented group is white and Asian mixed race students.
These hugely unequal numbers certainly say something troubling about British society. But none of this proves that there is institutional racism at Oxford, of course – as the university has argued, differences in schooling and background could mean that its cohort simply reflects inequalities already well entrenched when students begin applying for places.
We can get a bit closer to answering this question by looking at acceptance rates by ethnicity:

However, even this doesn't constitute concrete evidence of discrimination. Oxford has argued that non-white students are more likely to apply for the most competitive courses, such as medicine and law. Then there is also the possibility that some groups apply with better A-level results.
So what we really need are data broken down by ethnicity, subject, A-level results, and possibly even college – given that some are more competitive than others – to control for all of these other factors. At the moment, this is not available on the website. A university press officer told me that if the data were made any more fine-grained, it could cause problems for data protection and the numbers involved would be so small that they might be statistically useless.
But even then, at Oxford there other subjective factors at play, such as personal statements and interview performance, which we can never quite control for.
Trying to find evidence for or against racial discrimination in Oxford admissions is like peeling an enormous onion. You can strip away layer after layer of plausible explanations for ethnic disparities only to find yet another underneath. But it doesn't mean we should stop peeling.
Register to continue
Why register?
- Registration is free and only takes a moment
- Once registered, you can read 3 articles a month
- Sign up for our newsletter
Subscribe
Or subscribe for unlimited access to:
- Unlimited access to news, views, insights & reviews
- Digital editions
- Digital access to THE’s university and college rankings analysis
Already registered or a current subscriber?