
“Interdisciplinary research” has been a major buzz phrase in academia in recent years, making it a term that is sometimes hard to pin down beyond superficial platitudes.
How, then, can higher education institutions understand the links between different researchers, their value, and where the potential for new relationships lies? A number of scholars at a university in the US have attempted to bring more clarity to the subject by devising accessible and highly intuitive data “maps” that show the subjects and departments where interdisciplinary work at the institution is strongest.
It follows a challenge set by Duke University, a private institution in North Carolina, for its researchers to create visualisations based on the institution’s own database of staff – Scholars@Duke – which itself draws on publication data from bibliometric sources such as Scopus, PubMed and Web of Science.
Six teams took up the challenge of finding ways to represent the data and adopted various approaches.
Jeff MacInnes, a postdoctoral fellow in neurobiology, who won first prize in the challenge, used data on the physical locations of scholars to create an interactive map of the campus that showed how collaboration flowed between buildings.
Please click on map to enlarge
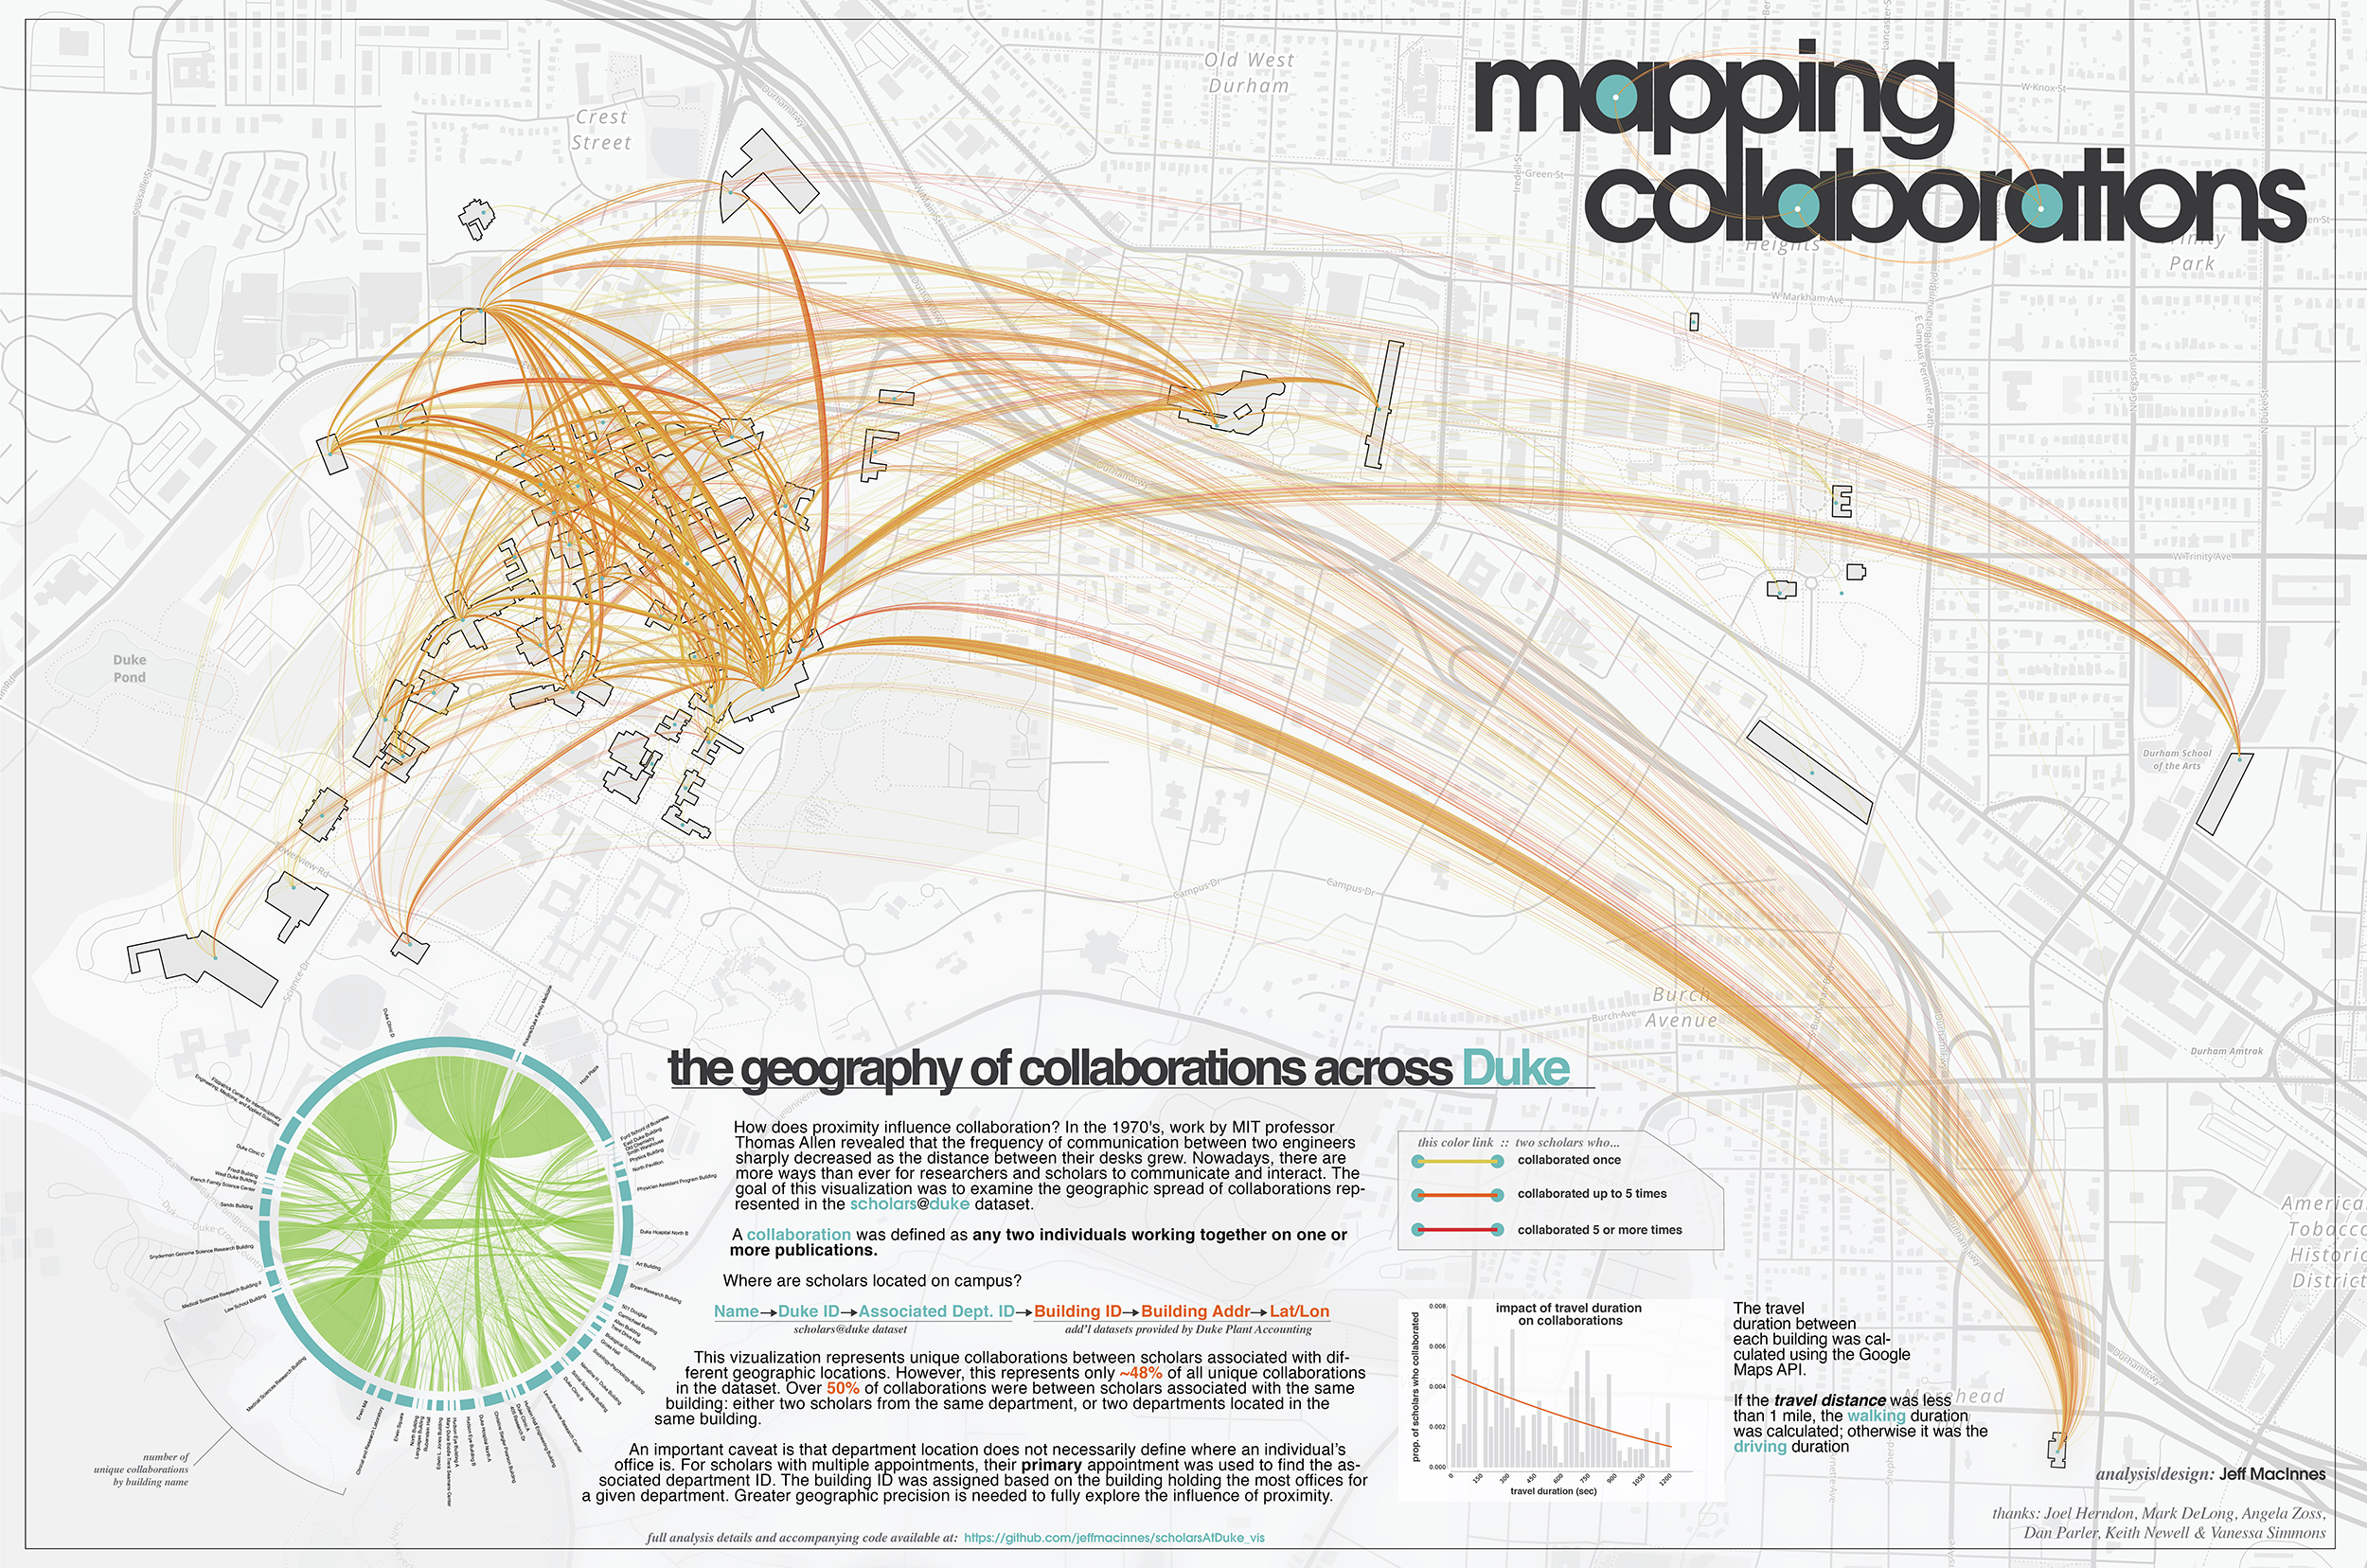
Dr MacInnes told Times Higher Education that he had expected to see “clustered islands of collaborations”, without much interdisciplinary work, stretching right across campus.
“It was a welcome surprise to find that wasn’t the case,” he said, adding that he was “encouraged by the breadth of collaborations in this dataset that occur in spite of the geographic separation”.
However, he said geography still played a vital role in bringing academics together despite the plethora of ways there now were to communicate remotely.
“It’s tempting to think that geographic proximity isn’t as crucial to successful research collaborations as it might have once been. Certainly within this visualisation, large distances aren’t a drastic impediment to collaboration,” said Dr MacInnes. “But I think an argument could be made that these technologies are better at facilitating existing collaborations rather than engendering new ones.”
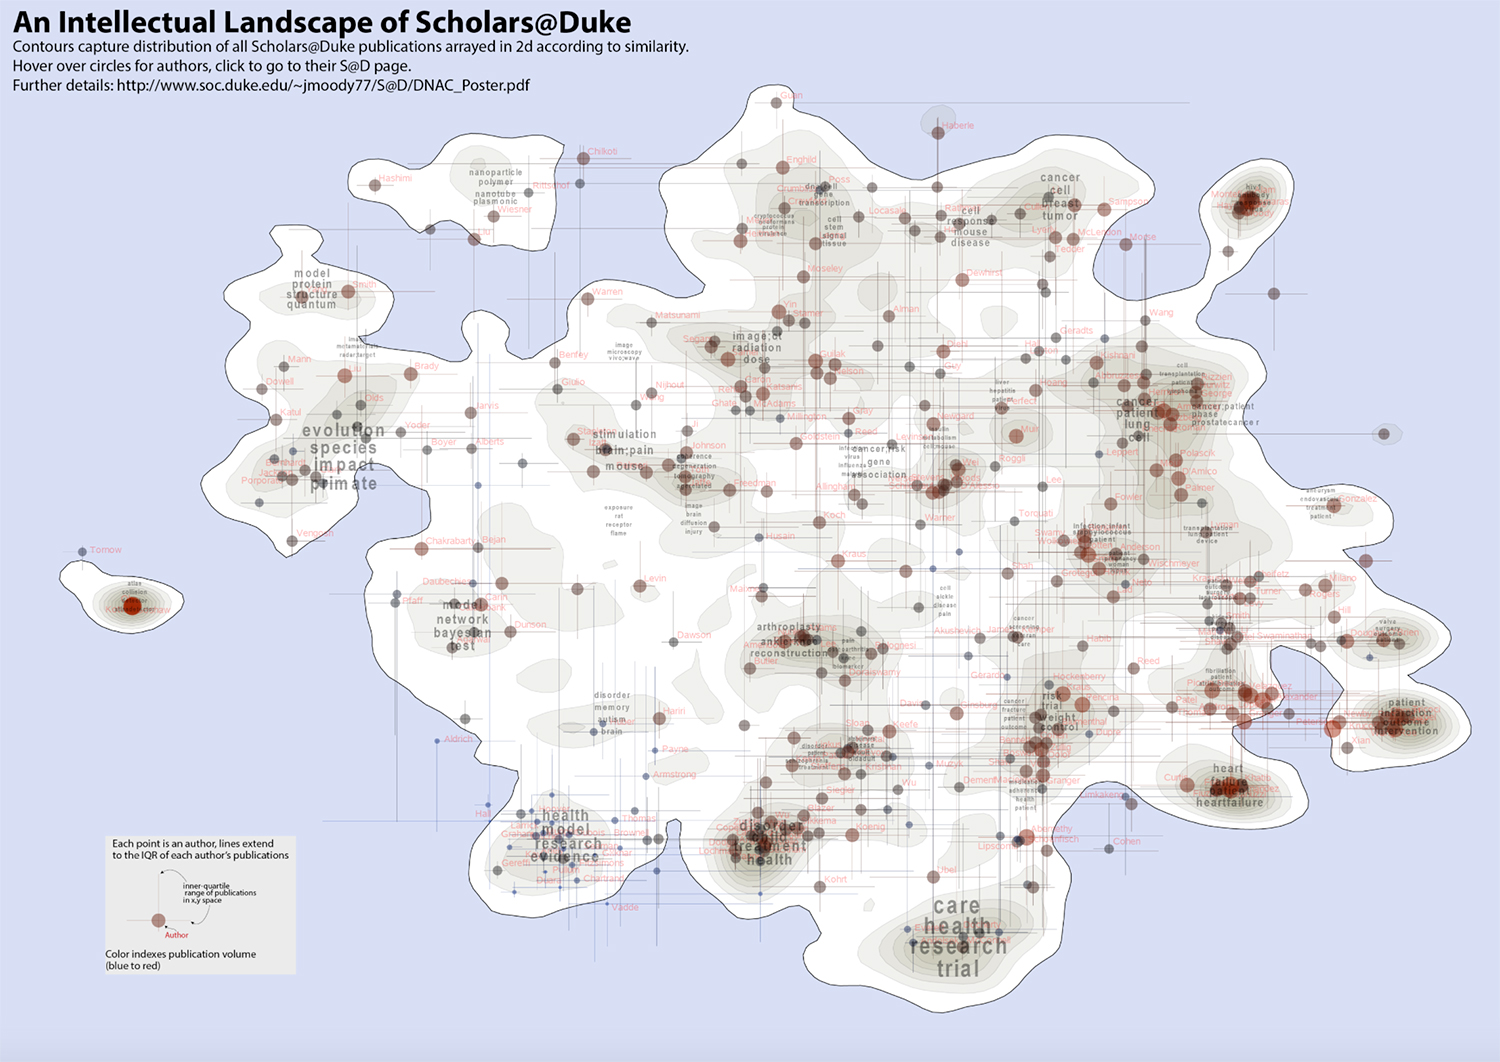
James Moody, Robert O. Keohane professor of sociology at Duke, and his team also took a mapping approach, but they focused on the “intellectual space” inhabited by scholars rather than their physical location.
Using language analysis to determine where similar phrases were used in different papers, they were able to show where collaborations occurred along subject lines. The result is a map that has the appearance of a topographical view of an island, with peaks representing clusters of topics where a lot of research has been published.
Please click on map to enlarge
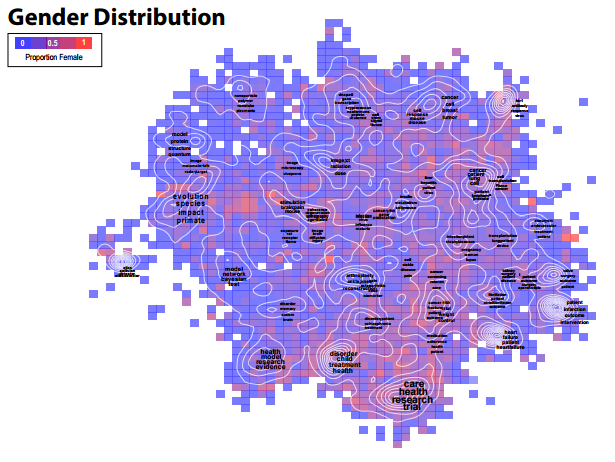
The team also produced other visualisations by overlaying additional data, such as a heat map showing the distribution of researchers by gender.
Professor Moody said the “topical landscape” revealed by the main data “really highlight the diversity of research related broadly to health and medicine, and its relation to work in the natural, engineering and computational sciences”.
He added that there were surprises, such as research into various types of cancer not always being closely connected, and other fields being almost completely disconnected from the main landscape.
Professor Moody said that in the long term, such mapping “might provide a nice interface” for searching for collaborators.
“Just like exploring a map to an unknown city, you can learn a lot by just poring over the details of your neighbourhood. We think it might also be useful for thinking about where to invest in new science: blank places (or low-volume places) in the map represent new opportunities to explore.”
Find out more about THE DataPoints
THE DataPoints is designed with the forward-looking and growth-minded institution in view
Register to continue
Why register?
- Registration is free and only takes a moment
- Once registered, you can read 3 articles a month
- Sign up for our newsletter
Subscribe
Or subscribe for unlimited access to:
- Unlimited access to news, views, insights & reviews
- Digital editions
- Digital access to THE’s university and college rankings analysis
Already registered or a current subscriber?
