The Times Higher Education-QS World University Rankings aim to capture the essence of a world-class university. This involves quality teaching and research, both of which we attempt to measure. Because a global institution will also be a magnet for academic talent, we analyse institutions’ abilities to attract staff and students from beyond their own shores. But we also consider the informed opinion of two groups – university academics and major recruiters of graduates – that have a unique insight into institutions’ strengths.
This means that our ranking of the world’s top 200 universities is a compound index that uses qualitative data derived from surveys alongside quantitative data on topics such as staff and student numbers and scholarly citations. The 2008 rankings use much the same method as in 2007 but with more and better data.
For us to consider a university, it must undertake work in at least two of the major academic fields: the natural sciences; biomedicine; engineering and information technology; the social sciences; and the arts and humanities. It must also teach undergraduates. This means that these rankings do not include many excellent specialist institutions, mainly medical colleges and business schools. But many universities that do not teach a full range of subjects, principally specialist science and technology colleges, show up well here.
A fundamental tenet of this ranking is that academics know which are the best universities. Getting their opinion has been the most time-consuming part of the exercise and is also its most distinctive feature.
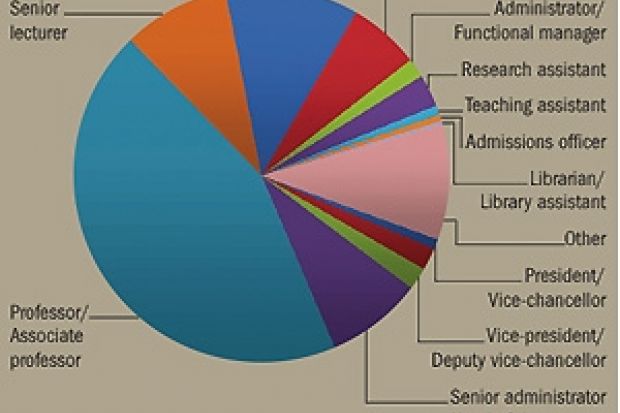
As the chart shows, the academics we consult are spread around the world and range from lecturers to university presidents. They have to enter our survey from an academic site (.edu or an equivalent), and they have a simple task: to name up to 30 institutions they regard as being the best in the world in the field in which they work.
In practice, the academic peer reviewers – who cannot vote for their own institution – choose about 20 universities each. To increase the statistical power of the survey, we aggregate data up to three years old, although we use only the most recent reply from anyone who has responded more than once. The result for 2008 is a survey of 6,354 people. With each person nominating an average of 20 universities, this means we have more than 120,000 data points.
This academic review, the most significant element of the rankings, accounts for 40 per cent of an institution’s score. The other qualitative element, accounting for 10 per cent, is a survey of major employers of graduates across the world and across a range of businesses. The people contacted are active recruiters. They are simply asked from which universities they like to recruit, and again this survey amalgamates up to three years of data. This year’s recruiter survey includes the opinion of 2,339 recruiters in every field, from mining to the media.
Quantitative measures
The other half of a university’s possible score in this ranking uses quantitative measures intended to capture quality in key university activities.
The first of these, worth 20 per cent of a university’s score, is a measure of staff-to-student ratio, which we believe tells us something about whether a university has enough people to teach the students it admits. QS gathers the data on staff and student numbers from a range of sources. Some come from national statistical bodies such as the Higher Education Statistics Agency in the UK and the National Center for Education Statistics in the US, but many of the data are collected from universities directly, under a controlled definition of who may be counted as a staff member or student. Both figures are full-time equivalents.
Our understanding of the information that makes up this column has been growing. One of the most spectacular climbs in our top 200, in which the University of Michigan rose from 38 in 2007 to 18 now, has been caused mainly by our use of more accurate staff and student numbers.
A further 20 per cent of an institution’s score comes from a measure intended to assess the international esteem of its research. Here, we look at the number of citations to published papers from a university and divide it by the number of full-time equivalent staff it employs. We use this approach rather than the more conventional measure of citations per paper because it reveals the density of creative brainpower on a campus.
The citations data we use cover a five-year period and come from Scopus. We accept that all such data have some inherent biases, especially towards publishing in English.
Our final two measures, each worth 5 per cent of a university’s score, are designed to tell us how serious an institution is about globalisation and how successful it is at attracting staff and students from around the world. This lets us see which institutions and nations are most committed to bringing in the best talent and which institutions people want to be at.
The results obtained by each institution on all these measures are graded using a Z-score, with the top mark set at 100 to make the table more readable.
We are always keen for ideas to improve these rankings, but we have considerable confidence in the strength of the methods we use today.