
Browse the full Times Higher Education Europe Teaching Rankings 2018 results
The Times Higher Education Europe Teaching Rankings use a balanced scorecard approach, with 13 individual performance indicators combined to create an overall score that reflects the broad strength of an institution.
The metrics, which focus on the student teaching and learning environment and student outcomes, have been designed to answer the questions that matter most to students and their families when making one of the most important decisions of their lives – who to trust with their education.
The performance indicators are grouped into four key areas:
– Engagement – does the institution effectively engage with its students?
– Resources – does the institution have the capacity to effectively deliver teaching?
– Outcomes – does the institution generate appropriate outputs for students?
– Environment – is the teaching and learning environment inclusive?
The methodology was modelled on those of our previous teaching-focused rankings: the Wall Street Journal/THE US College Rankings and the THE Japan University Rankings.
At its heart are the results of the THE European Student Survey, which feed into seven of the 13 performance indicators and account for 50 per cent of universities’ final scores. The survey examines a range of key issues including students’ engagement with their studies, interaction with teachers, opportunities to develop skills and views on the quality of services at their institution.
These are the survey questions that are used in the ranking (students were asked to answer on a scale of zero to 10):
- To what extent do you have the opportunity to interact with the faculty and teachers at your university as part of your learning experience?
- To what extent does your university provide opportunities for collaborative learning?
- To what extent does the teaching at your university support critical thinking?
- To what extent does the teaching at your university support reflection upon, or making connections among, things you have learned?
- To what extent does the teaching at your university support applying your learning to the real world?
- To what extent have the classes you have taken in your university so far challenged you?
- If a friend or family member were considering going to university, based on your experience, how likely or unlikely are you to recommend your university to them?
- Do you think your university is effective in helping you to secure valuable internships that prepare you for your chosen career?
- To what extent are you satisfied with the access to learning materials (such as library, texts, labs and online material) at your university?
- To what extent are you satisfied with the quality of the learning environment (such as lecture halls, study areas, and labs) at your university?
- To what extent do you think that the teaching at your university is supporting you to learn skills that will be useful in the world of work after university (for example writing, numeric, presentation or other skills)?
- To what extent do you have the opportunity to learn about and make connections to the world of work after university (for example through work placements, careers advice)?
For all enquiries and questions about this ranking, please email: europerankings@timeshighereducation.com
THE podcast: Europe Teaching Rankings explained
Exclusions
The ranking only includes universities in countries that are a full member of both the European Higher Education Area and the Organisation for Economic Cooperation and Development, and that are classified as a “developed economy” by the United Nations.
Universities are eligible for inclusion only if they offer courses and programmes that lead to officially recognised higher education degrees such as bachelor’s degrees and master’s degrees or equivalent; are focused on more than one narrow subject area; and have at least 5,000 enrolled students at bachelor’s or equivalent level. Institutions must also receive a minimum of 50 valid responses in the THE European Student Survey to be included.
In cases where institutions have not provided the required data, we have used data from other external sources or provided an estimate. We have excluded institutions if this has not been possible or if the data for a particular institution are too sparse. We also excluded countries for which too few institutions submitted data, resulting in a lack of comparison with institutions within the country to create a meaningful score.
Data sources
Data come from a variety of sources: direct submissions from institutions, websites of institutions, the THE European Student Survey, the THE Academic Reputation Survey and Elsevier’s bibliometric dataset.
We also used data from national statistical agencies such as the UK Higher Education Statistics Agency (Hesa), the Federal Statistical Office of Germany (DESTATIS), Portugal’s Directorate General of Statistics of Education and Science (DGEEC), the Association of Universities in the Netherlands (VSNU) and the Netherlands Association of Universities of Applied Sciences, as well as governments’ education departments.
Our data are, in most cases, normalised so that the value we assign in each metric can be sensibly compared with other metrics.
The THE Europe Teaching Rankings will be published on this site at 21.01 on 11 July.
The new rankings will be launched at the THE Teaching Excellence Summit at the University of Glasgow from 10-12 July, where a data masterclass with THE’s data and analytics director, Duncan Ross, will explore the results and methodology in detail. Register now to join the discussions.
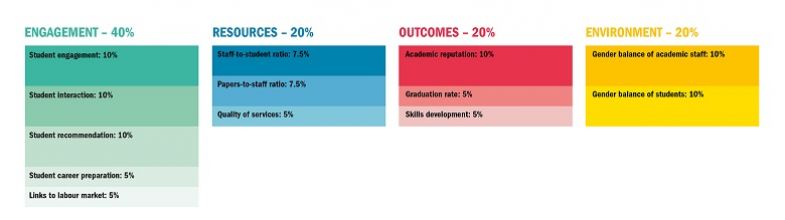
Engagement – 40%
- Student engagement: 10%
- Student interaction: 10%
- Student recommendation: 10%
- Student career preparation: 5%
- Links to labour market: 5%
All the data in this pillar are gathered through the THE European Student Survey, carried out in partnership with market research provider Streetbees. The survey collected the views of more than 30,000 university students across 10 European countries on a range of issues relating to their higher education experience.
Students answered nine core questions on a scale of zero to 10 and provided background information about themselves. The survey was conducted online and respondents were recruited by Streetbees using social media and student representatives at individual universities. Respondents were verified as students of their reported institution through their email address.
At least 50 valid survey responses were required for a university to be included in the ranking. The data were rebalanced by gender to reflect the actual gender ratio of students at the institution.
To capture engagement with learning, we looked at the answers to four questions: to what extent does the student’s university support critical thinking?; to what extent does the teaching support reflection on, or making connections between, the things that the student has learned?; to what extent does the teaching support apply the student’s learning to the real world?; and, finally, to what extent do the classes taken challenge the student?
To capture students’ opportunity to interact with others, we used responses to two questions: to what extent does the student have the opportunity to interact with faculty and teachers?; and to what extent does the university provide opportunities for collaborative learning?
The student recommendation metric is based on the question: “If a friend or family member were considering going to university, based on your experience, how likely or unlikely are you to recommend your university to them?”
To measure career preparation, students were asked how effective their institution was at helping to secure valuable internships that prepare them for their chosen career, while the measure on links to the labour market was based on a question asking to what extent the institution provided opportunities for students to learn about and make connection to the world of work.
Resources – 20%
- Staff-to-student ratio: 7.5%
- Papers-to-staff ratio: 7.5%
- Quality of services: 5%
By looking at the ratio of academic staff members to students (both full-time equivalent), we get an overall sense of whether an institution has enough teachers to teach. It also gives a broad sense of class sizes and how likely it is that a student will receive the individual attention required for them to succeed at university. These data come from institutions’ submissions, institutions’ websites and statistical agencies.
To measure productivity, we count the number of papers published in the academic journals indexed by Elsevier’s Scopus database between 2012 and 2016 per academic staff, scaled for institutional size. Scholars who are experts in their academic fields and engaged in pushing the boundaries of knowledge can significantly enhance a student’s educational experience by demonstrating, for example, the power of real-world problem-solving.
The third metric is based on the average scores of two questions in the THE European Student Survey, which asked students to assess their access to learning materials and the quality of their learning environment.
Outcomes – 20%
- Academic reputation: 10%
- Graduation rate: 5%
- Skills development: 5%
This section looks at universities’ records in delivering successful outcomes for students – an increasingly important mission given the growing concerns in many countries over the affordability and value of higher education.
The most prominent indicator in this category looks at a university’s reputation for teaching excellence among its peers, based on the responses to our 2018 THE Academic Reputation Survey. This survey was carried out in January to March 2018, attracting 10,162 responses. We only used teaching votes provided by academics associated with European institutions.
The graduation rate measures the share of students that graduate within the nominal length of their course of study. It shows whether institutions within a country have a strong track record in supporting students to complete their degree programmes.
The skills development metric is based on a question in the THE European Student Survey, which asked students whether the teaching at their university supported them to learn skills that will be useful in the world of work.
Environment – 20%
- Gender balance of academic staff: 10%
- Gender balance of students: 10%
This category looks at the gender balance of students and academic staff at a university to give a sense of whether the institution provides a diverse and inclusive learning environment for students. Universities with a 50:50 ratio of female to male academic staff are rewarded with a top score of 100, while those that are skewed towards one gender receive a lower score. The student metric is calculated in the same way.
Times Higher Education's data and analytics director Duncan Ross answers questions about the Europe Teaching Rankings from delegates at the Teaching Excellence Summit.
POSTSCRIPT:
Print headline: A change of focus
Register to continue
Why register?
- Registration is free and only takes a moment
- Once registered, you can read 3 articles a month
- Sign up for our newsletter
Subscribe
Or subscribe for unlimited access to:
- Unlimited access to news, views, insights & reviews
- Digital editions
- Digital access to THE’s university and college rankings analysis
Already registered or a current subscriber? Login