Student election map: how the THE data team got the results
Emma Deraze and Duncan Ross explain the methodology behind the analysis on where students could impact the 2017 general election
Share
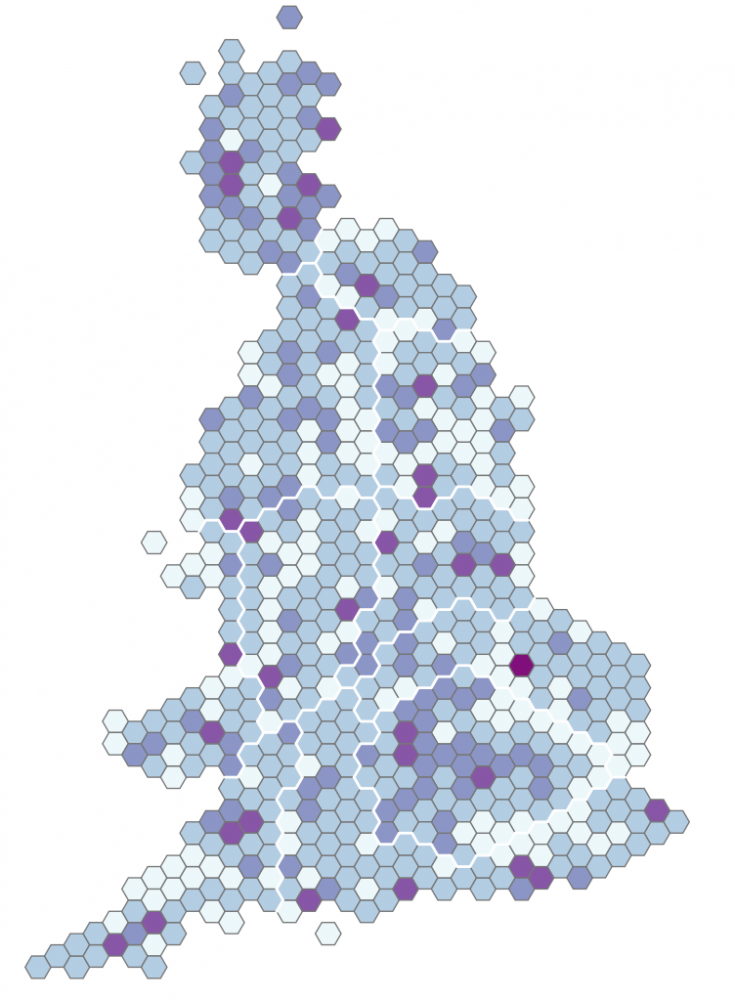
When trying to understand the potential influence of individual universities for the general election we decided to take into account several factors: the student population by constituency in the 2011 Census, the number of UK students in a university, the location of university campuses, and how close the result of the 2015 general election was.
The resulting dataset allows you to identify the constituencies where students could have the greatest possible impact. But there are obvious caveats: we don’t know how students voted in 2015, and we know that many students chose to vote in their “home” rather than their “university” constituency (where these differ).
We also don’t have an accurate way of splitting students among campuses for multi-campus universities, and our decision on which campuses to include or exclude involved making some subjective judgements (we asked our editorial team for their guidance).
Data sources:
-
Census data 2011
-
General election results 2015
-
University students numbers: Higher Education Statistics Agency 2015
-
Campus addresses: Hesa, Wikipedia
-
Constituency centres from https://www.doogal.co.uk/ElectoralConstituencies.php
-
Visualisation only: University of East Anglia, (@chrishanretty)
Step-by-step methodology:
1. Redistribute student numbers across all campuses for each university
- List all significant campuses per uni
- Redistribute university student numbers (UK students only) in an even split
- → Each campus has an estimated number of students Campus_Stu
2. Calculate the constituencies linked to each university
- For each campus, compare geo-coordinates of the campus to neighbouring constituencies and attribute a maximum of 5 constituencies to each campus if the 2 locations are <= 10km apart.
3. Calculate a constituency’s “potential student impact” score:
- Get the win margin of the 2015 election results (log) → Margin (<1)
- Get the number of students in constituency according to the 2011 census (scaled variable) → Student_PC
- Calculate constituency “potential student impact” score → Const_Inf = Margin * Student_PC * 100
4. Calculate each university’s “share of constituency”:
- Sum all Campus_Stu values per constituency → total per constituency Const_Campus_Sum
- Campus share of the constituency (%) → Campus_Const_PC = Campus_Stu / Const_Campus_Sum
5. Calculate each university’s “potential influence” score:
- Per campus, calculate campus score → Camp_Inf = Camp_Const_PC * 100 * Const_Inf
- Sum all campus scores per uni → Uni_Inf = sum(Camp_Inf)
Notes and caveats:
-
Student campus split: as we do not have complete and reliable data on the number of students in each campus, we redistribute a university’s student numbers evenly across all its campuses. Minor campuses are excluded.
-
We assume that students’ term-time accommodation (the address they may be registered at) is in a constituency with a centre less than 10km from the campus. This assumption may not be true for some locations, for example London.
-
We use the winning margin of each constituency regardless of who was the winner. We leave it to the reader to decide if Conservative or Labour marginals are more vulnerable in this election - we are only accounting for the fact that a small number of votes might be able to swing the results either way.
-
During the last election, YouthSight estimated that 60 per cent of students voted at home. Our analysis assesses the potential influence a university’s students may have if they voted in the constituency where we estimate they might be living while studying. We are aware of the fact that a large proportion of a university’s students will in fact probably vote in another constituency.
-
As staff numbers are usually much smaller than student numbers we have ignored them, even though they will clearly have an impact.
Emma Deraze is data scientist for THE's World University Rankings and Duncan Ross is data and analytics director.