
Last week I wrote a blogpost for the Council for the Defence of British Universities, in which I discussed the government’s higher education Green Paper. The Green Paper is a consultation document that introduces, among other things, the teaching excellence framework (TEF).
This is an evaluation process for teaching that is intended to parallel the research excellence framework (REF). I argued against it. I’m concerned that the imposition of another complex bureaucratic exercise will do damage to our higher education system, and I think that the case for introducing it has not been made. Among other things, I noted that there was little evidence for the claim that there was widespread dissatisfaction among students. Put simply, my argument was: if it ain’t broke, don’t fix it.
A day after my blogpost appeared, there was a select committee meeting of the department of Business, Innovation and Skills to take oral evidence on topics relating to the Green Paper. The oral evidence is available here as a transcript. This is fascinating, because there appeared to be a difference of opinion between the minister, Jo Johnson, and the others giving evidence in terms of their views of the state of teaching in our universities. The most telling part of the session was when Jo Johnson was challenged on his previous use of the word “lamentable” to describe teaching in parts of our higher education system.
Read more: Jo Johnson under fire for calling some university teaching ‘lamentable’
Johnson clearly wanted to move away from discussions about his choice of words and on to the “evidence”. I’m going to focus here on what he said about results from the National Student Survey (NSS). There are many pertinent questions about how far the NSS can be taken as evidence of teaching quality, but I will leave those to one side and just focus on what the minister said about it, which was:
In the NSS 2015 survey, two-thirds of providers are performing well below their peers on at least one aspect of the student experience; and 44 per cent of providers are performing well below their peers on at least one aspect of the teaching, assessment and feedback part of the student experience.
I was surprised by these numbers for two reasons: first, they seemed at odds with other reports about the NSS that had indicated a high level of student satisfaction. Second, they seemed statistically weird. How can you have a high proportion of providers doing very poorly without dragging down the average – which we know to be high? I looked in vain online for a report that might be the source of these figures. Meanwhile, I decided to look myself at the NSS 2015 results, which fortunately are available for download here.
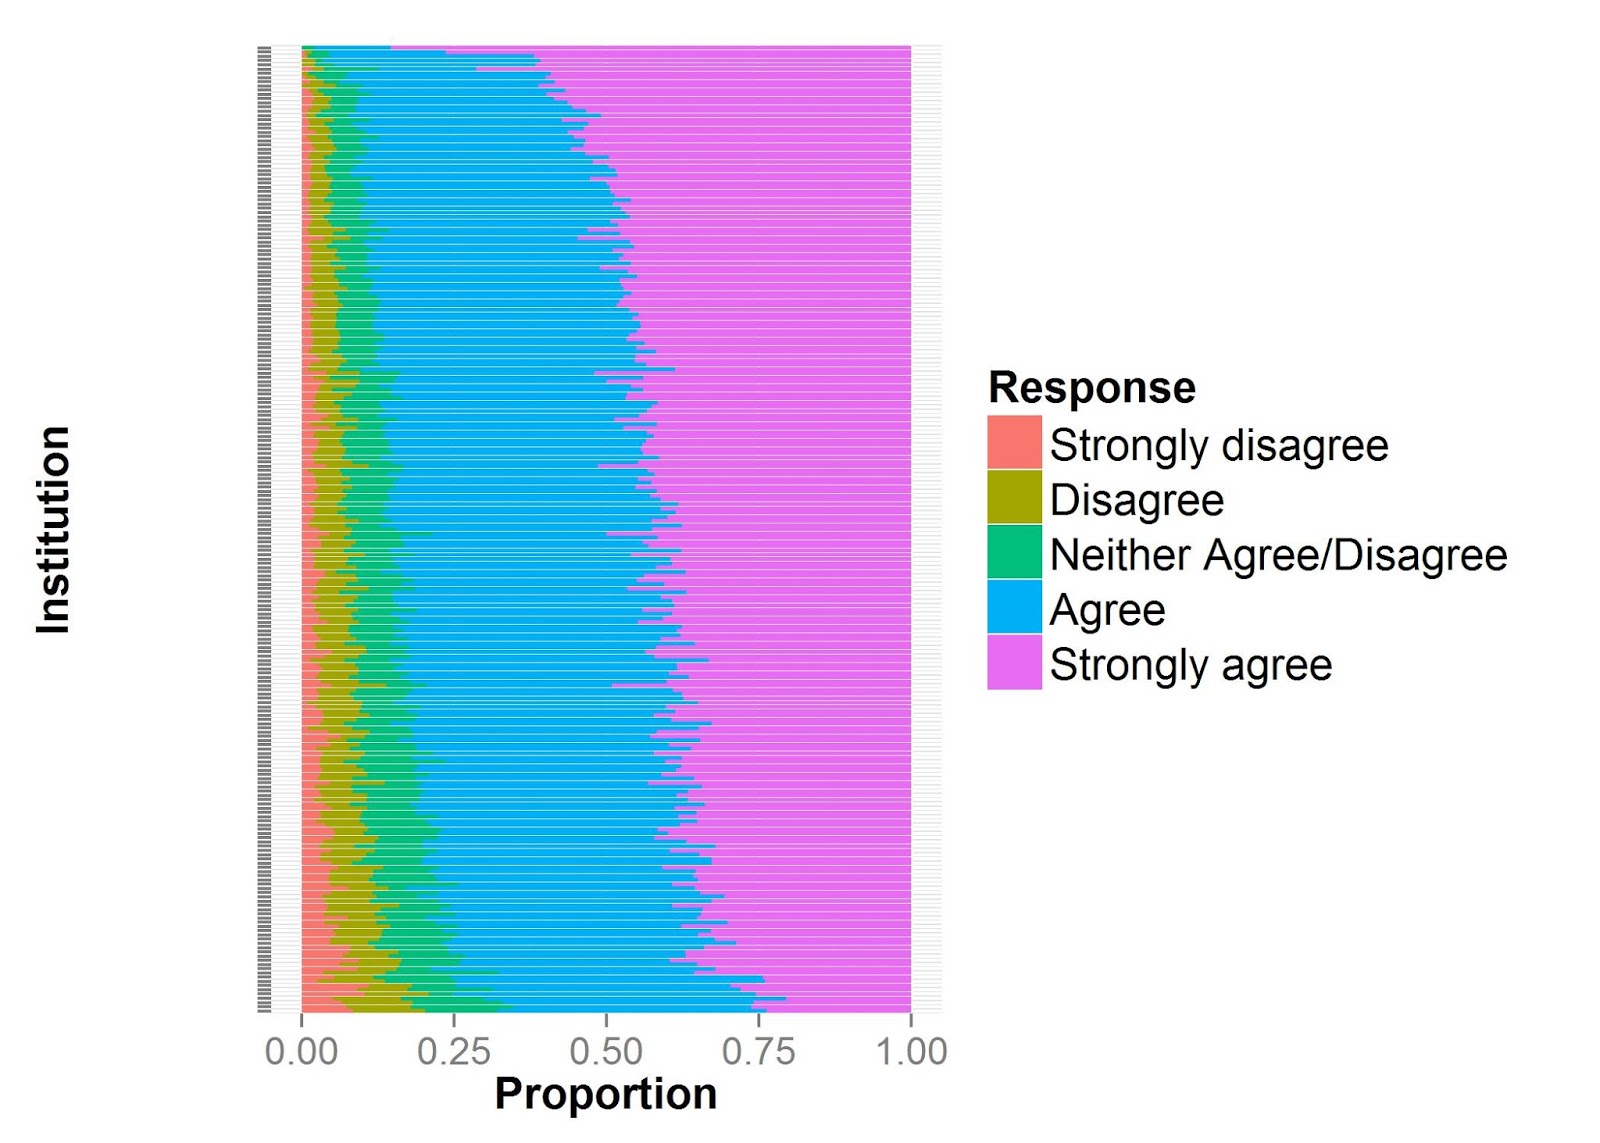
All items in the NSS are rated from 1 (definitely disagree) to 5 (definitely agree). I focused on full-time courses, and combined all data from each institution, rather than breaking it down by course, and I excluded any institutions with fewer than 80 student responses, as estimates from such small numbers would be less reliable. Then, to familiarise myself with the data, and get an overall impression of findings, I plotted the distribution of ratings for the final overview item in the survey, ie, “Overall, I am satisfied with the quality of the course”.
As you can see below, the overwhelming majority of students either “agree” or “definitely agree” with this statement. Few institutions get less than 75 per cent approval, and none has high rates of disapproval.
Johnson’s comments, however, concerned individual items on the survey.
As you can see in the table below, there is variation between items in ratings, with lower mean scores for those concerning feedback and smooth running of the course, but overall the means are at the positive end of the scale for all items.
| Item | Mean (SD) |
| 1. Staff are good at explaining things. | 4.19 (0.11) |
| 2. Staff have made the subject interesting. | 4.12 (0.14) |
| 3. Staff are enthusiastic about what they are teaching. | 4.3 (0.14) |
| 4. The course is intellectually stimulating. | 4.19 (0.17) |
| 5. The criteria used in marking have been clear in advance. | 4.02 (0.19) |
| 6. Assessment arrangements and marking have been fair. | 4.01 (0.19) |
| 7. Feedback on my work has been prompt. | 3.79 (0.24) |
| 8. I have received detailed comments on my work. | 3.95 (0.23) |
| 9. Feedback on my work has helped me clarify things I did not understand. | 3.85 (0.21) |
| 10. I have received sufficient advice and support with my studies. | 4.09 (0.16) |
| 11. I have been able to contact staff when I needed to. | 4.27 (0.16) |
| 12. Good advice was available when I needed to make study choices. | 4.11 (0.15) |
| 13. The timetable works efficiently as far as my activities are concerned. | 4.09 (0.18) |
| 14. Any changes in the course or teaching have been communicated effectively. | 3.95 (0.24) |
| 15. The course is well organised and is running smoothly. | 3.87 (0.27) |
| 16. The library resources and services are good enough for my needs. | 4.19 (0.26) |
| 17. I have been able to access general IT resources when I needed to. | 4.28 (0.23) |
| 18. I have been able to access specialised equipment, facilities or rooms when I needed to. | 4.11 (0.23) |
| 19. The course has helped me to present myself with confidence. | 4.18 (0.13) |
| 20. My communication skills have improved. | 4.31 (0.13) |
| 21. As a result of the course, I feel confident in tackling unfamiliar problems. | 4.21 (0.12) |
| 22. Overall, I am satisfied with the quality of the course | 4.16 (0.18) |
It could be argued that Johnson was quite right to focus not so much on the average or the best, but rather on the range of scores. However, the way he did this was strange, because he computed percentages of those who did poorly on any one of a raft of measures. This seems quite a high bar, as a low rating on a single item could create the impression of failure.
In order to reproduce Johnson’s figures, I had to work out what he meant when he said that an institution performed “well below” its peers. I looked at two ways of computing this. First, I just considered how many institutions fell below an absolute cut-off on ratings: I picked out cases where there were 20 per cent or more ratings in categories 1 (strongly disagree) or 2 (disagree); this was entirely arbitrary, and determined by my personal view that an institution where one in five students is dissatisfied might be looking to do something about this. Using this cut-off, I found that 24 per cent of institutions did poorly on at least one item in the range 1-9 (covering teaching assessment and feedback), and 35 per cent were rated poorly on at least one item from the full set of 22 items. This was about half the level of problems reported by Johnson.
I wondered whether Johnson had used a relative rather than absolute criterion for judging failure. The fact that he talked of providers performing “well below their peers” suggested that he might have done so. One way to make relative judgements is to use z-scores, ie, for every item, you take the mean and standard deviation across all institutions and then compute a z-score that represents how far this institution scores above or below the average on that item.
Using a cut-off of one standard deviation, I obtained numbers that looked more like those reported by Johnson – 43 per cent doing poorly on at least one of the items in the range 1-9, and 59 per cent doing poorly on at least one item from the entire set of 22. However, there is a fatal flaw to this method: unless the data have a strange distribution, the proportions scoring below a z-score cut-off are entirely predictable from the normal distribution: for a one SD cutoff, it will be about 16 per cent.
You’d get that percentage, even if everyone was doing wonderfully, or everyone was doing very poorly, because you are not anchoring your criterion to any external reality. For anyone trained in statistics this is a trivial point, but to explain it for those who are not, just look again at Table 1. Take, for instance, item 21, where the mean rating is 4.21 and standard deviation 0.12. These scores are tightly packed and so a score of 4.09 is statistically unusual (one SD lower than average), but it would be harsh to regard it as evidence of poor performance, given that this is still well in the positive range.
I have no idea what method Johnson relied upon for the statistics he presented: I am trying to find out. But meanwhile, I have to say that I find it disturbing that NSS data appear to have been spun to paint the state of university teaching in as bad a light as possible. We know that politicians spin things all the time, but it is a serious matter if a government minister presents public data in a misleading way when giving evidence before a select committee.
Those working in primary and secondary education, and in our hard-pressed health service, are already familiar with endless reorganisations that are justified by arguing that we “cannot stand still” and must “remain competitive”. We need to draw back from extending this approach to our higher education system. Of course, I am not saying that it is perfect, and we need to be self-critical, but the imposition of yet another major shake-up, when we have a system that has an international reputation for excellence, would be immensely damaging, and could leave us with a shortage of the talent that universities depend upon.
Dorothy Bishop is professor of developmental neuropsychology in the department of experimental psychology, University of Oxford. This is an edited version of a post that appeared on her own blog.
Notes:
You can reproduce what I did by looking at this R script, where my analysis is documented. This has flexiblity to look at alternative ways of defining the key item in Johnson’s analysis, ie, the definition of “well below one’s peers”.
PS. Another source of evidence cited in the Green Paper is this report from HEPI. Well worth a read. Confirms widespread student satisfaction with courses. Does show that “value for money” is rated much higher in Scotland (low fees) than England (£9,000 per annum).
Register to continue
Why register?
- Registration is free and only takes a moment
- Once registered, you can read 3 articles a month
- Sign up for our newsletter
Subscribe
Or subscribe for unlimited access to:
- Unlimited access to news, views, insights & reviews
- Digital editions
- Digital access to THE’s university and college rankings analysis
Already registered or a current subscriber? Login


